

Every month, federal agencies release data on price changes across the United States economy, presenting two numbers side by side. One is headline inflation, which captures the broad change in consumer costs, and the other is core inflation, which removes grocery bills and energy expenses from the calculation. While households spend a substantial share of their monthly budget at the pump and the supermarket, central bankers and market analysts track the core reading to understand where underlying price pressures are moving over time.
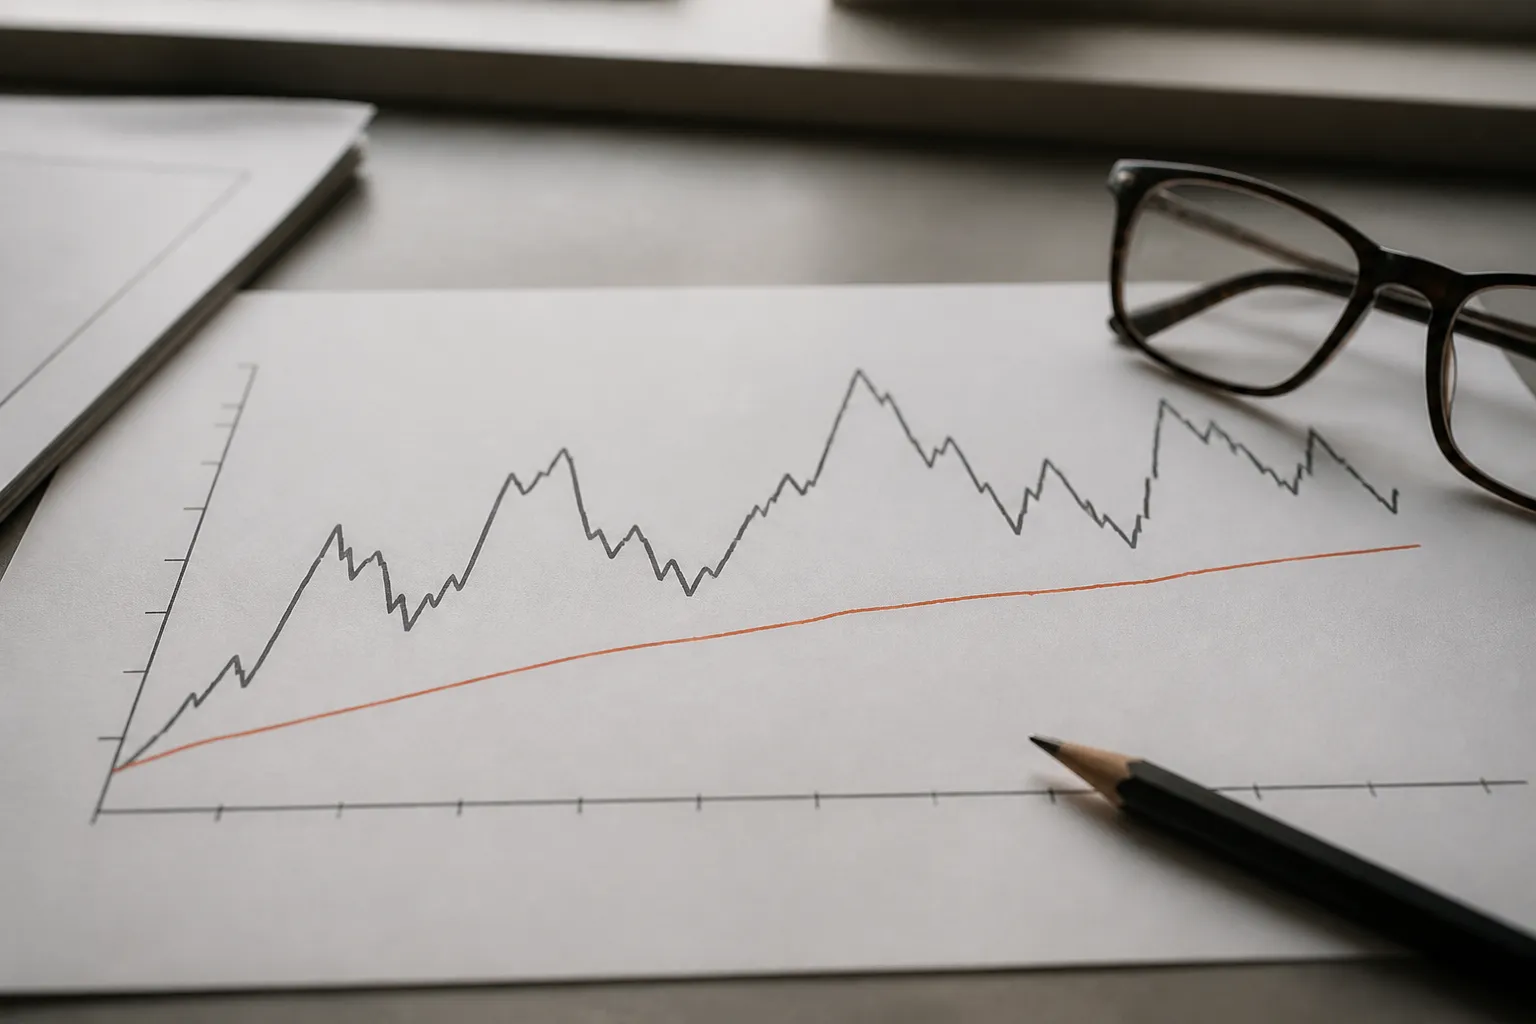
Core measures leave out items whose large price changes in one period are not typically followed by another large change in the same direction.
What inflation means in the first place
Inflation is a general increase in the overall price level of goods and services across the entire economy. It is not the same as a single item becoming more expensive. If gasoline prices spike due to refinery repairs or egg prices climb because of an outbreak at poultry farms while other costs hold steady, that single change is an isolated price shift rather than general inflation. Economists reserve the term for a broad, sustained rise in what an entire representative basket of household purchases costs.
Because inflation describes conditions across millions of commercial transactions, policymakers track several separate price measures. The Federal Reserve notes that officials follow multiple indexes because each is built around different data sources and reflects different segments of economic activity. The Consumer Price Index (CPI), produced by the Bureau of Labor Statistics, measures the out-of-pocket spending of urban consumers. In contrast, the Personal Consumption Expenditures (PCE) price index, produced by the Bureau of Economic Analysis, captures a wider scope of goods and services, including expenses paid by third parties such as employer-sponsored healthcare. Because these measures are calculated differently, each can send a distinct signal about price conditions.
What core inflation is
Core inflation is defined as an inflation measure that excludes the more volatile categories of food and energy. A core calculation can be applied to several different series, including the CPI, the PCE price index, or the gross domestic product deflator. While the headline number accounts for every category in the basket, the core number strips out the prices that bounce erratically from one month to the next.
The exclusion of groceries and utilities does not mean economists consider those expenses trivial. Every household feels the direct pressure when fuel or grocery totals increase. Instead, the Federal Reserve Bank of San Francisco explains that core measures are designed to address a specific analytical question: after setting aside temporary price spikes that may soon reverse, is the fundamental trend of prices accelerating, flattening, or slowing down?
Because core inflation is an analytical adjustment rather than a standalone index, two published core rates often show different numbers. Core CPI and core PCE rely on different expenditure weights, different data inputs, and different mathematical formulas. Before assessing whether price growth is changing, observers must verify which underlying index the core figure comes from.
Why food and energy are reported separately
Food and energy are reported separately because their market prices are uniquely exposed to sudden supply shocks. A severe drought in the Midwest can slash crop harvests, an unseasonable freeze can destroy citrus yields, or geopolitical events can disrupt ocean shipping routes and crude oil extraction. When these supply disruptions hit, commodity prices can surge overnight. Once production normalizes or supply routes clear, those same prices often fall just as quickly.
These rapid adjustments rarely signal a lasting change in the general purchasing power of the dollar. In statistical analysis, large monthly price swings in food and energy are frequently followed by reversals rather than sustained momentum in the same direction. Including them in every policy assessment can produce false signals about where the broader economy is heading.
Separating these volatile sectors helps policymakers and analysts avoid overreacting to short-lived swings. If crude oil prices jump for three weeks due to temporary export restrictions, headline inflation numbers will rise immediately. If the rest of the price basket remains steady, concluding that the broader economy is overheating would lead to mistaken policy conclusions. The core index provides a baseline to see whether price increases are spreading through housing, personal services, and durable goods, or remaining isolated to fuel and groceries.
Why the Federal Reserve watches core PCE
When the Federal Open Market Committee conducts monetary policy, it focuses primarily on the PCE price index. The Federal Reserve prefers the PCE index because its broader scope better captures actual consumption patterns across the country, and it relies on core PCE to isolate the durable trajectory of inflation. Research published by the Federal Reserve Bank of St. Louis shows that core PCE makes the underlying inflation trend easier to see, as PCE food and energy components fluctuate widely around that central line.
Monetary policy tools, such as adjustments to short-term benchmark rates, affect economic activity with long and variable lags that average roughly two years. Because policy decisions take quarters or years to work their way through credit markets, business hiring, and household borrowing, central bankers cannot respond to monthly noise. They require an indicator that forecasts medium-term inflation trends accurately. Core PCE offers a clearer read on persistence than headline figures that swing on spot energy trading.
To evaluate these shifts, policymakers examine average figures over three-month, six-month, and twelve-month windows rather than betting on single reports. As tracked by the Bureau of Economic Analysis, the twelve-month change in the core PCE price index reached 3.0 percent across consecutive months in 2026 before edging to 3.1 percent in September 2026. Looking at multi-month averages helps determine whether small movements represent a genuine inflection point or routine statistical variation.
How to read core and headline figures without confusion
Headline and core inflation numbers serve two different purposes, and reading them clearly requires keeping their functions straight. Headline inflation measures the change in the total cost of living, which reflects what people actually pay at checkout registers and utility counters. Core inflation provides an estimate of underlying price stability across the rest of the marketplace. Neither metric is defective, but using one to answer the wrong question leads to confusion.
When reviewing economic reports or financial news, checking three specific details helps provide accurate context:
- The underlying index: Identify whether the reported figure comes from the CPI, the PCE price index, or another measure entirely.
- The measurement window: Check whether the change reflects a single month, an annualized monthly rate, or a twelve-month year-over-year comparison.
- The coverage: Note whether the headline number or the core number is being cited, and keep in mind that core figures intentionally leave out fuel and food.
A common mistake is reading a decline in the core inflation rate as an announcement that grocery receipts and fuel bills are falling. A moderating core figure simply indicates that underlying price growth in sectors like housing, medical care, and manufactured items is losing momentum. The actual prices paid for food and energy can move independently in the short term, which is why households must look to headline reports to track their present-day cash outlays.
Please seek a professional. This article is general information, not financial, tax or insurance advice. Please seek a licensed financial, tax or insurance professional about your own situation.