










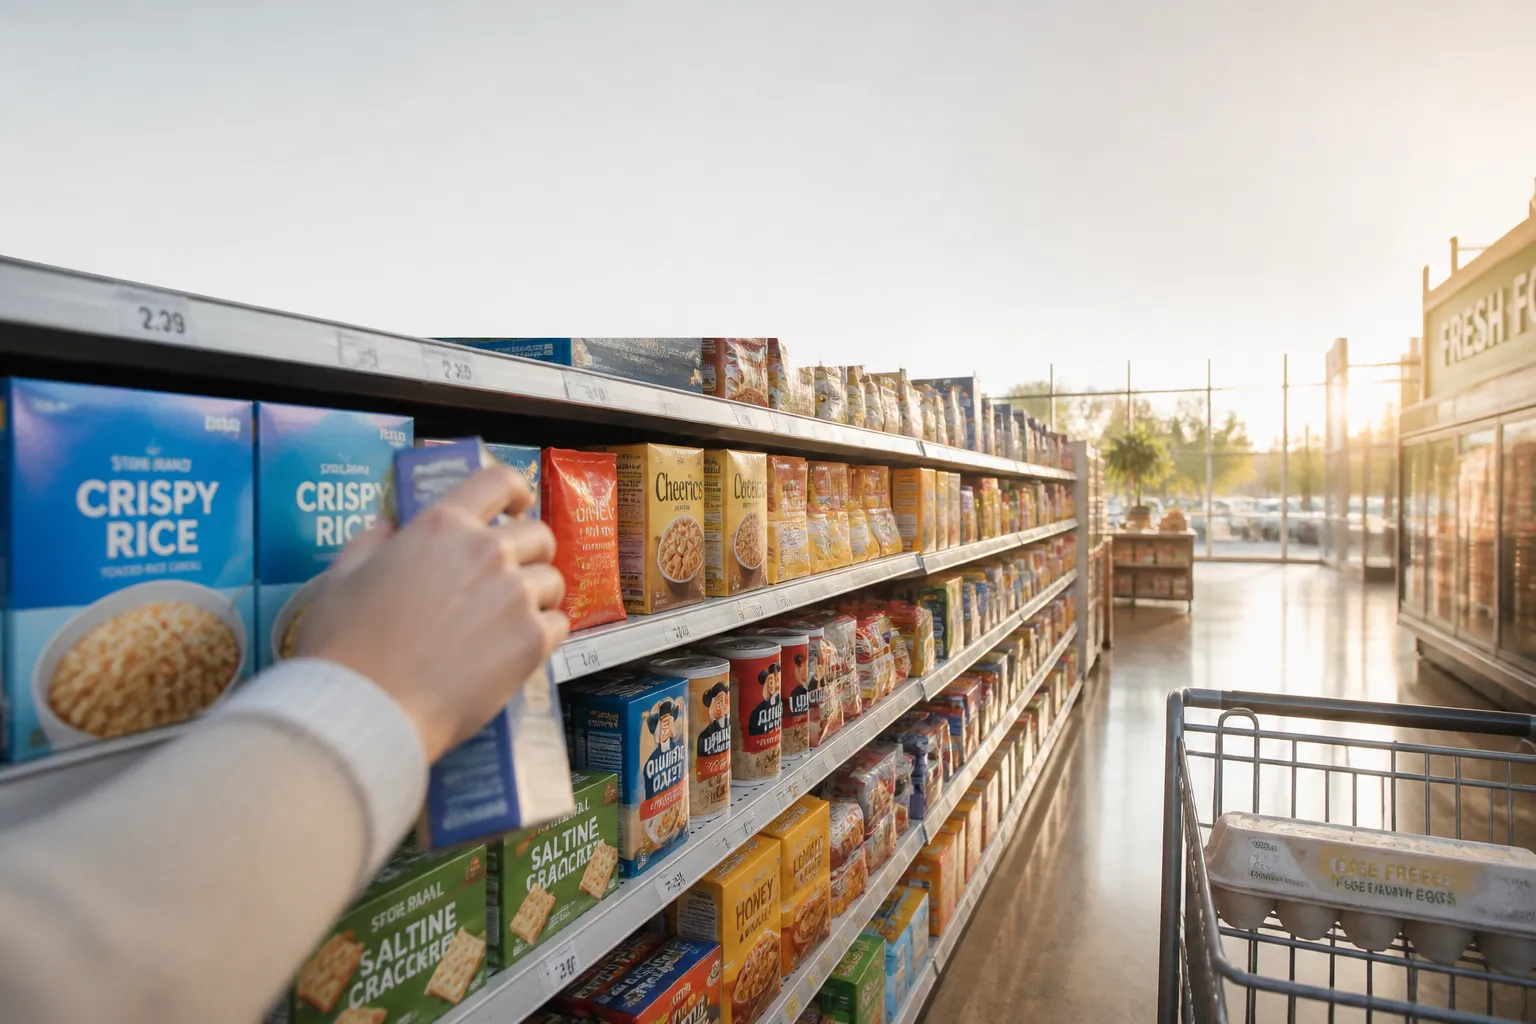
Evaluating grocery costs at the kitchen table often starts with a single line item, yet comparing grocery store brands to national name brands requires looking past the register total to the underlying arithmetic on the shelf. When families adjust their weekly spending to meet shifting cost-of-living pressures, small price variations across packaged goods compound into measurable differences over months of purchases.
- Identify the shelf price and find the total net weight or volume printed on the packaging.
- Locate the shelf label to check the calculated unit cost before placing either item in the cart.
- Verify that both the private brand and the brand-name item calculate their costs using an identical unit of measure.
- Assess whether the package dimensions reflect recent downsizing or formulation changes that alter the effective price.
Start with the unit price, not the shelf price
The total printed at the bottom of a shelf tag does not tell you what a product actually costs to consume. A store brand may sell in a fourteen-ounce box while a competing national brand sits beside it in a sixteen-ounce box. If the national brand carries a slightly higher shelf price, it might still deliver a lower cost per ounce. The only reliable metric for an even comparison is the unit price, which expresses the cost per standard unit of measure, such as per ounce, gram, or liter.
According to the National Institute of Standards and Technology (NIST), unit price labels typically display the product name, package size, total retail price, and the price per unit. Reading that secondary number prevents a shopper from mistaking smaller package dimensions for genuine savings. Package design can easily mask differences in net contents, making two cartons look identical from the aisle even when their actual volume differs by several ounces.
Checking unit pricing is also the most direct way to spot shrinkflation. NIST describes shrinkflation as the practice of selling products at an unchanged shelf price while slightly reducing the package contents. When a manufacturer trims two ounces from a standard cereal box or reduces a liquid detergent bottle by several fluid ounces, the shelf price remains steady, but the unit price rises immediately. Tracking that figure keeps household accounting accurate over time.
Read the labels and ask the right comparison questions
Direct shelf comparisons require consistent measurement standards. When comparing two brands of olive oil, soup, or laundry soap, confirm that both shelf tags use the same unit of measure. If one tag calculates cost per pound and the adjacent tag calculates cost per ounce, the numbers cannot be matched without a manual calculation. While shelf tags generally aim for uniformity within an aisle, inconsistent labeling formats can occasionally appear across different sections of a store.
A practical comparison also requires matching the underlying products on equal terms. A store brand whole-wheat loaf must be weighed against a brand-name whole-wheat loaf rather than an enriched white loaf with different ingredients and serving sizes. Concentrated liquids, multi-pack paper products with varying sheet counts, and different moisture levels in canned beans can also shift the real value. Shoppers should verify that both packages offer comparable quantities and preparation requirements before deciding that a lower unit price represents a true discount.
Package reformulations also happen without fanfare on both sides of the aisle. Brand-name manufacturers and private-label suppliers both adjust their packaging over time to manage production costs. Checking the net weight printed on the front of the box during routine shopping trips confirms whether a regular staple has quietly changed size since the last visit.
Understand what the industry savings figures measure
Aggregate trade data provides a broader view of how store brands fit into national consumer spending. According to reports from the Private Label Manufacturers Association (PLMA), store brand annual sales reached $282.8 billion in 2025, capturing a 23.5% unit share of the market. Over the period between 2021 and 2025, annual store brand dollar sales grew by $64.8 billion, representing a 30% increase as dollar share expanded from 19.1% to 21.3%.
The association estimates that consumers saved roughly $35 billion in 2025 by selecting store brands over national brands during regular grocery trips. That estimate is based on storewide price comparisons using average cost per unit across supermarkets, drug chains, mass merchandisers, and online channels, using data compiled by Circana. In 2025, store brand dollar sales rose 3.3% compared with 1.2% for national brands, while store brand unit volume grew 0.6% as national brand volume declined by 0.6%.
While these broad statistics demonstrate that private label goods are capturing a larger share of household budgets, they do not guarantee a fixed percentage discount on any individual item on the shelf. The $35 billion figure represents an aggregate calculation across thousands of categories and retailers. It illustrates general market shifts, but kitchen-table grocery decisions still come down to the specific unit price on the tag in front of you.
Know the limits of the evidence and where drugs differ
Published grocery research does not provide a single, universal price gap between store brands and national brands for standard grocery staples. The discount varies by category, region, and retail chain, which means no blanket savings rule can replace looking at the shelf. Furthermore, trade data does not measure objective differences in product performance, taste preferences, or ingredient sourcing, leaving those trade-offs to each consumer to evaluate personally.
The economic dynamic changes substantially when moving from the food aisle to the pharmacy counter. For prescription medications, the price gap between brand-name and non-brand alternatives is established through formal market structures. The Association for Accessible Medicines estimates that generic drugs are generally 80% to 85% less expensive than their brand-name counterparts. Research from the Food and Drug Administration (FDA) confirms that generic drug prices drop significantly as multiple generic manufacturers enter the market and compete.
That 80% to 85% reduction is unique to regulated pharmaceuticals and cannot be projected onto grocery items or household paper goods. Prescription choices also involve medical oversight that packaged goods do not. Consumers evaluating generic drug options should speak directly with a prescriber or pharmacist, recognizing that federal drug regulations follow an entirely separate pricing model from standard retail grocery shelves.


