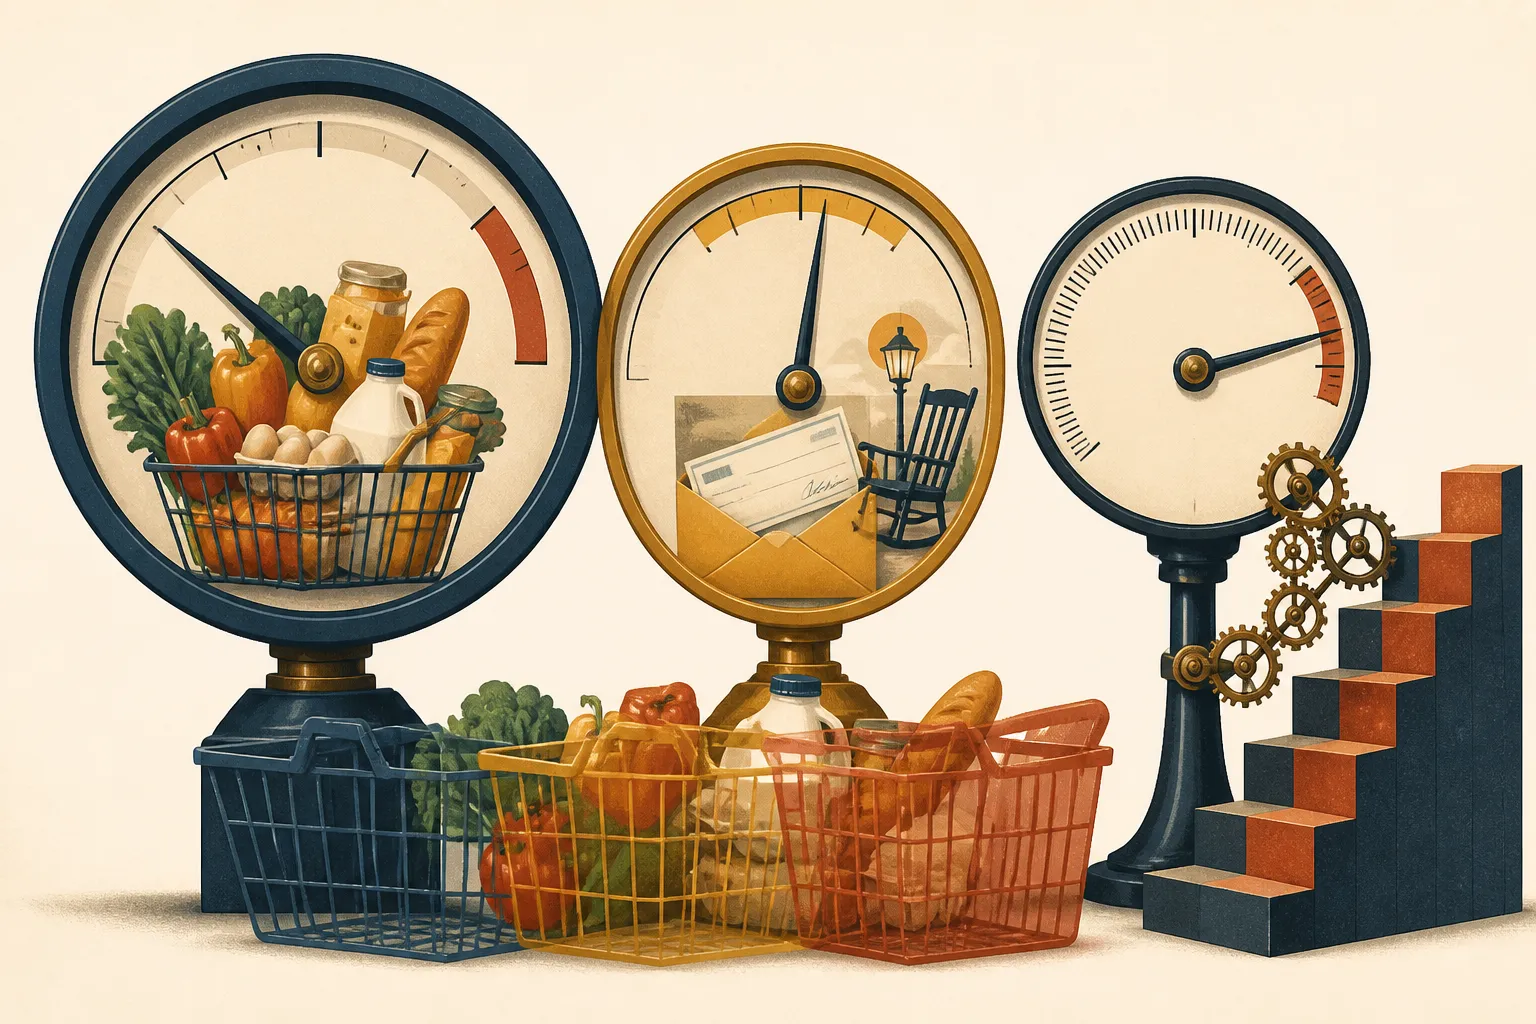
When the federal government reported that annual inflation sat at 3.7 percent for the twelve months ending in September 2026, plenty of people looked at their own bank statements and wondered which country the statisticians were measuring. A single trip to the auto repair shop or a lease renewal notice can make a three-point-something average feel detached from reality. The gap between the national headline and your kitchen table comes down to how a price index is built. The Consumer Price Index tracks a fixed, nationwide average basket of goods and services, and no real family buys the exact national average.
What the national basket actually measures
The Consumer Price Index, published by the Bureau of Labor Statistics, is a yardstick for price movement across the economy rather than a cost-of-living calculator for any single household. To build it, the government tracks price changes over time across a consistent basket of more than 200 individual items. Those items are organized into eight major spending categories:
- Apparel
- Education and communication
- Food and beverages
- Housing
- Medical care
- Recreation
- Transportation
- Other goods and services
Every category in that basket carries a specific weight, which represents how much of a typical household budget goes toward those items. According to USAFacts, those weights are derived from surveys of more than 20,000 households and individuals. When the government surveys that many people through programs like the Consumer Expenditure Survey, the resulting math blends millions of distinct lives into one composite consumer. That composite household simultaneously pays rent, owns a home, buys groceries, commutes by car, and pays for medical care in exact national proportions.

Why your kitchen-table math looks different
Your personal inflation rate diverges from the national number the moment your spending habits depart from that 20,000-household average. If you spend a larger share of your monthly income on a category where prices are rising fast, your personal budget will tighten much faster than the headline CPI suggests. If you spend very little in that category, your costs may barely budge.
Housing is the clearest example of how index weights shape the headline number. In the CPI, the housing category covers shelter, utilities, and household operations, and it holds the largest share of the entire index. Because its weight is so heavy, even modest shifts in national housing costs pull the overall CPI up or down more than sharp swings in smaller categories. Detailed federal documentation on rent and rental equivalence and the owners' equivalent rent FAQ lay out the technical rules for how the government prices shelter.
In practice, individual housing costs rarely move at the national average pace. A homeowner locked into a fixed-rate mortgage from years ago sees a very different monthly shelter bill than a renter signing a new lease in a tight city market. The same divide shows up on the road and at the pharmacy. A rural commuter driving fifty miles a day feels every cent of a spike in auto insurance or fuel, while a remote worker barely notices. A family managing chronic health conditions with high out-of-pocket bills lives in a different price environment than a twenty-something who visits a clinic once a year.
How category rates and weights combine
To see how the index blends these forces together, look at the breakdown for the twelve months ending in September 2026. Overall annual inflation for all items (CPI-U) was 3.7 percent. Inside that single figure, individual categories moved at widely different speeds, and each category's contribution to the 3.7 percent total depended on both its price jump and its weight in the basket.
Housing contributed 1.5 percentage points to the annual rate, accounting for about two-fifths of all headline inflation over that year. Transportation saw the steepest price increase of any of the eight major categories, rising 7.9 percent over the twelve-month period. Because transportation also represents a sizable chunk of household spending, that 7.9 percent surge added 1.31 percentage points to the overall 3.7 percent rate. Food and beverages, by contrast, contributed 0.35 percentage points to the annual total.
At the quiet end of the ledger, medical care prices rose 1.5 percent over the same year, the lowest rate among the eight categories. When a category experiences falling prices, it posts a negative inflation rate and actively pulls the headline number down. The 3.7 percent figure is simply the net result of all eight categories pulling against one another. If your household budget was dominated by transportation and housing between September 2025 and September 2026, you lived closer to the 7.9 percent side of the ledger than the 1.5 percent side.
Index adjustments that may not match your habits
Beyond category weights, the statistical rules used to calculate the CPI can also create distance between the official rate and your checkout receipt. An analysis from Citrine Capital notes that the CPI uses a substitution approach and adjusts for changes in product quality, two methodological choices that can make the index read lower than what some households feel.
The substitution effect assumes that when the price of a specific item rises, shoppers will trade down to a cheaper alternative. If beef prices climb, the index math accounts for consumers shifting toward poultry. That is a reasonable assumption across a whole economy, and it reflects how many people protect their budgets. Still, a household that cannot easily substitute will absorb the full brunt of the price hike. You cannot swap out a required prescription drug for a store brand that does not exist, and you cannot easily switch to a cheaper grocery chain if only one store operates within twenty miles of your home.
Quality adjustments work on a similar logic. When a product improves from one year to the next, such as a car or a laptop gaining new standard features, statisticians attribute part of its higher sticker price to the better quality rather than pure inflation. On paper, you are getting more product for your money. At the cash register, however, you still have to pay the full higher price, even if you never wanted the upgraded features in the first place.
Reading the CPI alongside your own budget
Commentary from Citrine Capital argues that official CPI figures can run lower than what many individual households actually experience. That perspective represents one advisory firm's view rather than an official government finding, and public data does not put an exact number on the gap between the national index and a typical family's ledger. Even so, the observation points to a sensible habit: treat the national CPI as a broad economic weather report, not a personal bank statement.
You do not need a complex formula to see where your own money is feeling the squeeze. Pull three months of your own bank and credit card statements from the past year and group your largest recurring bills into the same buckets the government uses: housing, transportation, food, and medical care. Compare the share of your income going to those bills against the category movements in the monthly BLS releases. If forty percent of your take-home pay goes toward keeping two cars on the road and paying rent, a year where transportation rises 7.9 percent is going to hit your checking account much harder than a 3.7 percent national average implies.