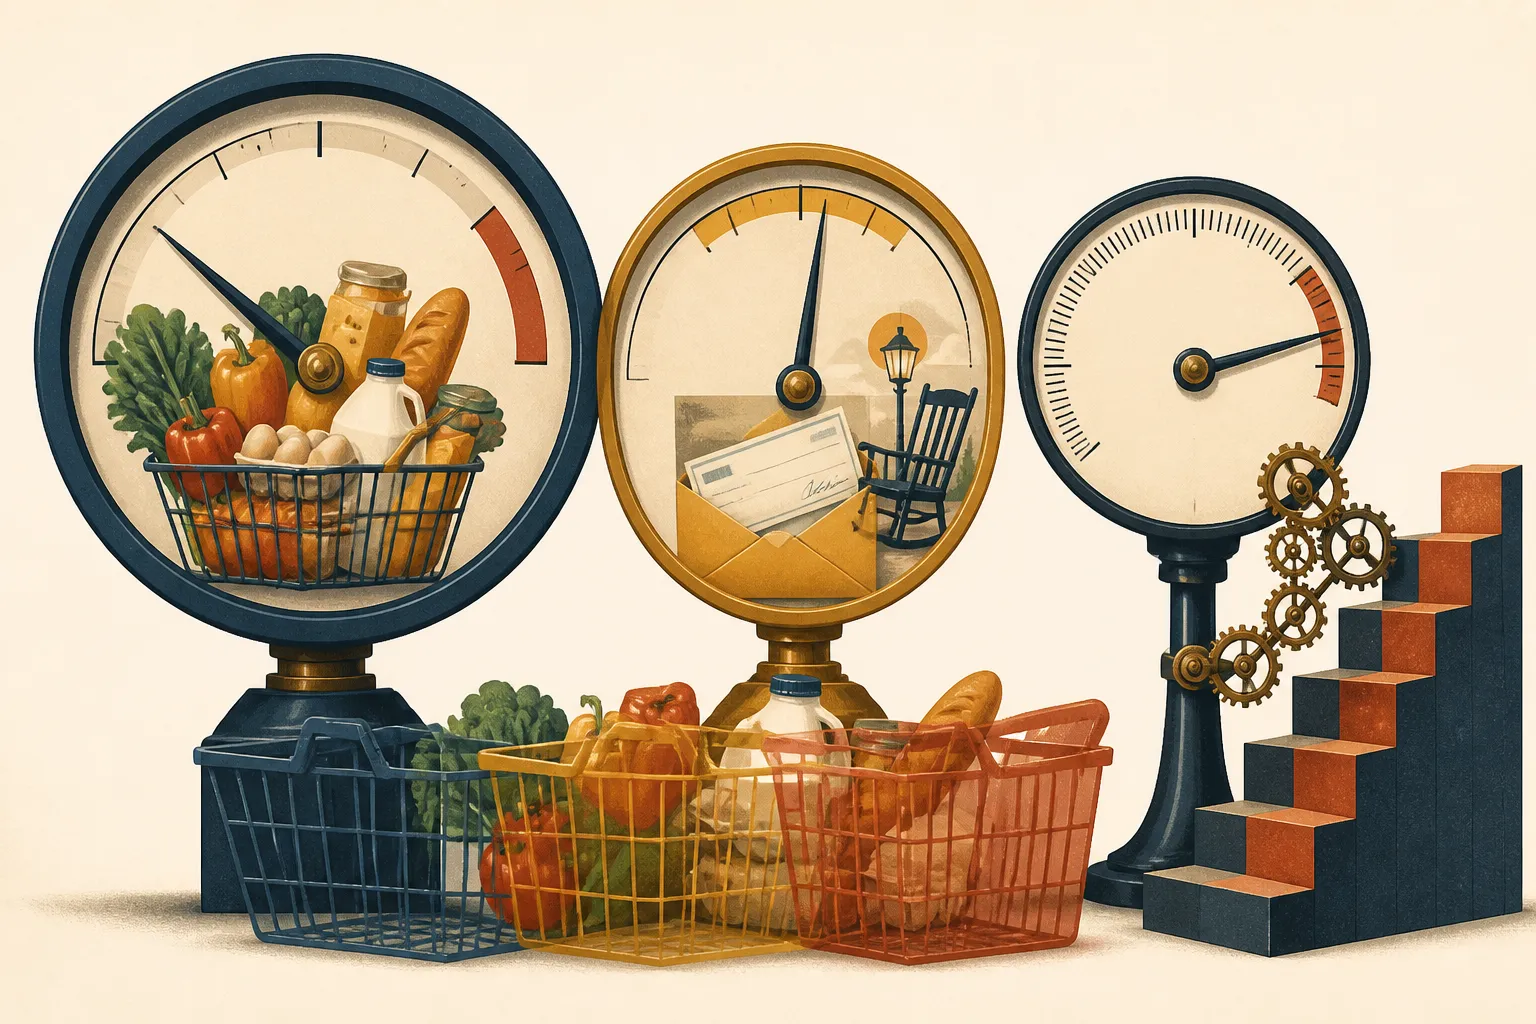
A grocery receipt from three years ago tells a quiet story about your paycheck. When you want to put hard math behind that feeling at the kitchen table, the CPI Inflation Calculator from the U.S. Bureau of Labor Statistics (BLS) offers a public baseline. Before you plug in a dollar figure, it helps to separate what the government data actually tracks from what it leaves out.
- A national average is not a personal receipt. The Consumer Price Index tracks a broad market basket of goods and services across urban areas, reflecting the spending patterns of more than 90% of the U.S. population.
- A paycheck raise can still mean a pay cut. Comparing past earnings to current dollars reveals whether your household income actually grew in real purchasing power or simply fell behind rising store tags.

- Slower inflation does not mean falling prices. Even when the monthly pace of inflation cools down from a peak, the underlying price level at the register usually stays elevated.
- Specific household bills move at their own speed. Regional price shifts and major spending categories like housing, medical care, and food often stray far from the national headline average.
What the CPI measures
Inflation is the measure of how much prices have risen over a given period. When the Federal Reserve sets interest rates, policymakers aim for 2% annual inflation. That 2% target serves as a steady reference point when you read monthly economic reports and wonder what normal price growth looks like.
Each month, the Bureau of Labor Statistics releases reports showing how prices changed over the previous month and over the full year. The most widely used measure in those reports is the consumer price index (CPI). The CPI tracks the change in prices paid by urban consumers for a standard market basket of consumer goods and services.
That market basket works as a weighted average of price changes across the many items American households buy. According to the BLS, the index reflects the spending patterns of more than 90% of the U.S. population. Because the number is built as a broad average, its monthly movement describes typical national price changes rather than the exact checkout experience of any one family.
How an inflation calculator uses the CPI
Free online inflation tools, including the official BLS calculator, compare price changes between two points in time. As PBS Wisconsin notes, a typical calculator lets you compare price changes over a set period so you can test whether your income is keeping up with living costs.
Kitchen-table math makes this concrete. Suppose you earned $50,000 a few years ago and earn $54,000 today. You can use an inflation calculator to measure how overall prices changed over that same window and convert your earlier pay into current dollars. If the calculator shows that $50,000 in past purchasing power requires $56,000 today to buy the same basket of goods, your $54,000 salary buys less than your old paycheck did. Your nominal pay went up, while your purchasing power fell.
Keep in mind that any calculator output is an estimate built on that national average basket. If your household drives very little, rents an apartment in a stable market, or buys mostly bulk staples, your personal cost of living will shift differently than the national benchmark. Read the result as a rough ruler, not an audit of your bank statement.
Choosing the right index for your situation
A single national number rarely captures the reality of every zip code. Beyond the headline average, the BLS publishes more specific inflation rates. These include figures for different geographic areas and separate breakdowns for major spending types such as food and beverages, housing, and medical care.
Those narrower figures can matter much more to your budget if most of your money goes toward one heavy category, such as rent or clinic bills, or if local prices in your city move faster than the national trend. However, general consumer guides do not explain how an individual household should choose between the national CPI and regional or category-specific indexes when building a personal budget. They also leave out the practical limits of using the CPI for individual cost-of-living math, such as wide regional gaps in healthcare or housing costs.
If the national calculator result looks nothing like what you see in your own utility and grocery bills, check the BLS income and CPI resources directly to review how different index definitions are structured before relying on a single number.
Current context and what remains unclear
Timing matters when you run these numbers. Inflation hit a three-year high in May 2026. While the rate of increase has slowed somewhat since that spring peak, most consumer prices are not expected to fall back to earlier levels. A slower inflation rate simply means prices are climbing at a gentler slope, leaving the cost of the grocery basket elevated.
Before you rely on the federal tool for major decisions, recognize where public overview materials leave gaps. The exact CPI series and mathematical base period powering the calculator are not stated in general summaries, nor are the step-by-step instructions for entering dollar amounts, picking months, and reading the output. You should confirm those mechanics directly on the calculator page. Similarly, if you need to know which monthly CPI figures are treated as official or how the agency handles data revisions, review the BLS CPI Frequently Asked Questions.
Finally, some people look up CPI data to understand formal cost-of-living adjustments, wage negotiations, Social Security changes, or commercial lease clauses. General calculator guides do not cover those rules. Readers looking for those mechanics should consult the BLS escalation resources directly. This article is for general educational purposes and is not personal financial, legal, or tax advice.