










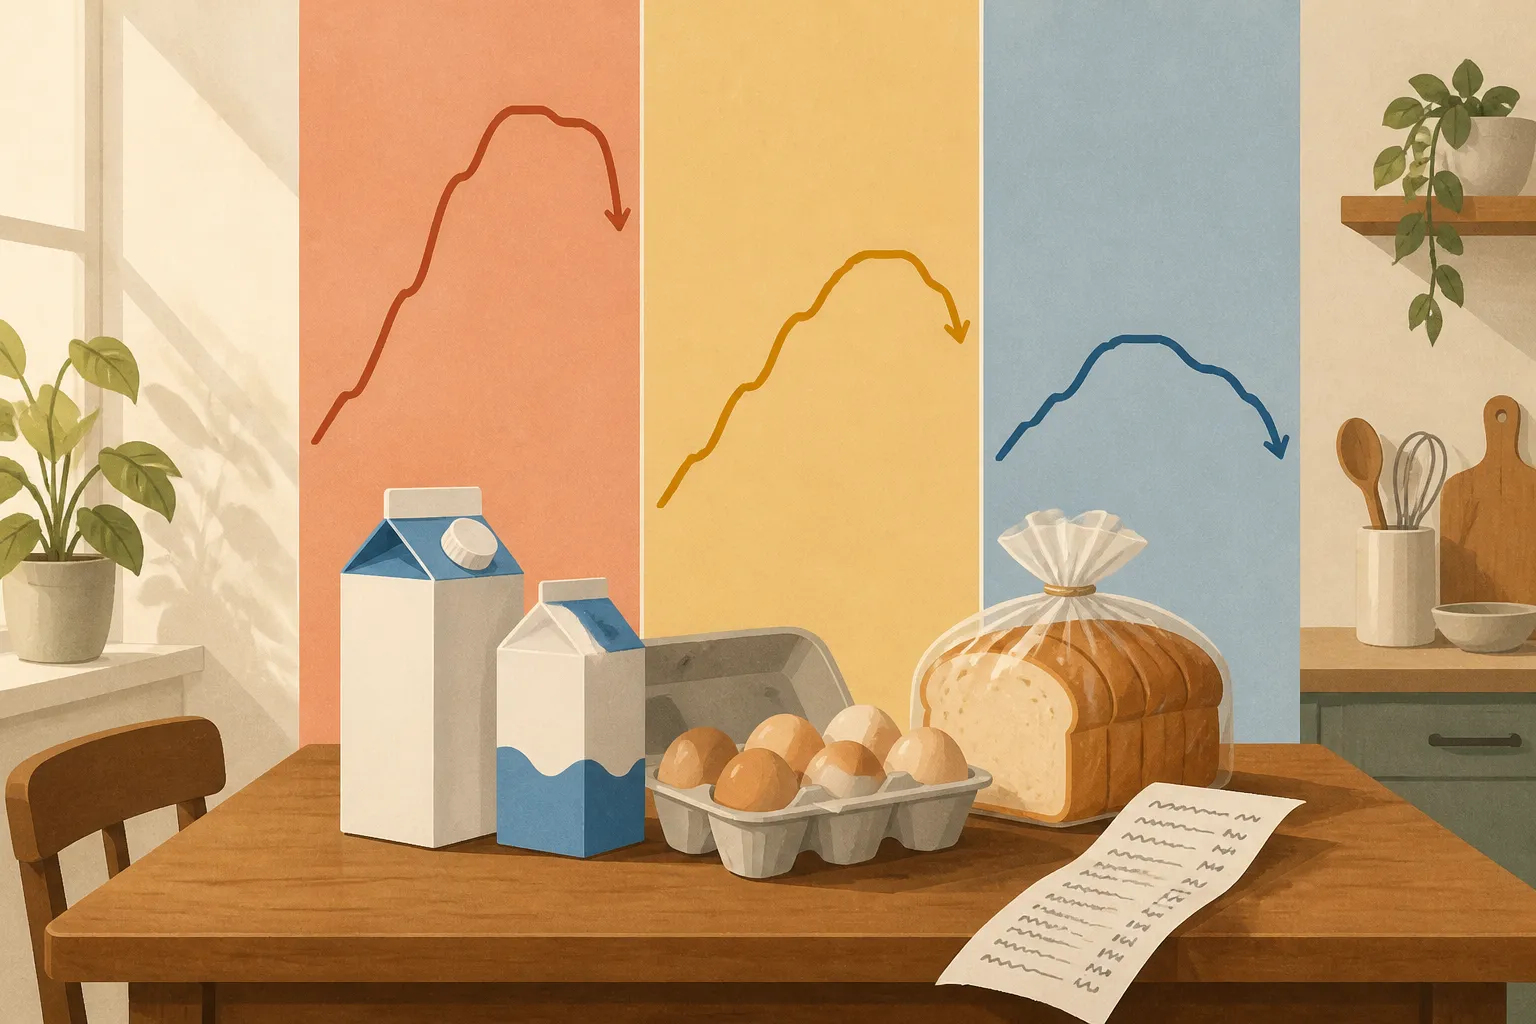
Take a standard grocery receipt that totaled $100 twelve months ago. Depending on the direction of the wider economy, that exact same cart of milk, eggs, and bread can do one of three things today. It can cost more, it can rise in price more slowly than it did the year before, or it can actually cost less. Economists use three distinct words for those movements, and mixing them up makes it much harder to read a monthly cost-of-living report or plan a household budget.
- Inflation is the rate at which general prices across the economy rise over a period, most commonly measured over a year. According to the International Monetary Fund, if the yearly inflation rate is 3%, that $100 basket of goods from last year costs about $103 today.
- Disinflation is a slowdown in the rate of inflation. Prices are still climbing, just at a gentler pace. If inflation drops from 6% one year to 3% the next, your grocery cart still gets more expensive, only by a smaller percentage than it did the year prior.

- Deflation is the actual decline of prices across the economy over time. Instead of rising more slowly, the typical cost of goods and services drops below where it started.
Why disinflation is not the same as falling prices
Of the three terms, disinflation and deflation cause the most confusion at the kitchen table. They sound nearly identical on an evening news broadcast, yet they describe very different realities for your checking account. Materials from Federal Reserve Education draw a firm line between the two: disinflation is a decrease in the inflation rate, whereas deflation means prices are actively falling.
A classic American example of disinflation happened in the early 1980s. Between 1980 and 1983, the U.S. inflation rate dropped from over 13% to under 4%. That was a massive relief for households, and a textbook case of disinflation. Even so, the general price tag on a gallon of gas or a loaf of bread did not rewind to 1979 levels. Prices kept marching upward every year during that stretch, just at a much calmer speed.
This distinction matters whenever you see a headline announcing that inflation has cooled or eased. Cooling inflation almost always points to disinflation. The upward pressure is relaxing, which helps paychecks catch up, but you should still expect the checkout total to be higher than it was twelve months earlier.
Why economists worry about deflation
On the surface, deflation sounds like a gift to anyone managing a tight budget. If a $100 grocery run drops to $97, your dollar stretches further. Yet central bankers and economists generally view broad deflation as a dangerous warning sign rather than a victory.
Deflation is typically a symptom of a weak economy with sluggish demand. As the Federal Reserve notes, the most famous period of severe deflation in U.S. history happened during the Great Depression. When prices fall across the board, human psychology shifts in a way that can stall commerce. If you know a washing machine or a car will cost less in six months, you have a strong incentive to wait and keep your cash in your pocket.
When millions of households delay purchases at the same time, businesses sell less, production slows, and economic growth can grind to a halt. The IMF points to Japan as a modern example of an economy that experienced a long stretch of near-zero growth partly linked to persistent deflation. To avoid that trap, the Federal Reserve aims to keep inflation low and stable while steering clear of deflation altogether. In fact, concern over a potential deflationary spiral after the 2007 global financial crisis was a primary reason the Fed and other central banks kept interest rates low for a prolonged period.
How inflation is measured and what it does to your money
To track these movements, the government relies on the consumer price index, or CPI. As explained in the IMF Back to Basics series, the CPI follows a representative basket of commonly purchased items through regular household surveys. The contents of this basket stay mostly constant so researchers can compare apples to apples over time, with occasional updates when consumer habits shift.
Consumer price inflation is simply the percentage change in that index. If the CPI sits at 100 in a base year and rises to 110 later on, prices have climbed 10%. In the United States, housing expenses, including rent and mortgages, make up the single largest share of the consumer basket. Because shelter carries so much weight, shifts in rent or housing costs heavily steer the headline number you hear on the news.
Economists also look at core inflation, which strips out government-set prices along with volatile food and energy costs. If a sudden spike in oil prices or a bad harvest drives up the headline CPI while core inflation stays flat, policymakers know the price pressure is concentrated in a few unpredictable aisles rather than spreading across the whole economy. At the extreme end of the spectrum sits hyperinflation, defined as prices rising 1,000% or more a year, where currency loses value almost immediately.
Even mild inflation reshapes household purchasing power. What matters most for your budget is real income, which is your income adjusted for inflation. Consider a retiree whose pension includes a fixed 5% increase every year. In any year where inflation runs above 5%, that retiree loses purchasing power despite receiving a bigger check. On the other hand, inflation treats debt differently. Fixed-rate borrowers can actually benefit when inflation rises because the real interest rate on their loan falls, allowing them to repay fixed balances with dollars that are worth less over time. Lenders, meanwhile, lose out if that inflation was not already baked into the original interest rate.
Questions to ask when you read inflation news
Economic reports rarely translate themselves into personal terms. While educational context cannot replace individualized financial advice, asking a few direct questions when the monthly numbers come out can help you judge what the data means for your own household.
- Is the report describing disinflation or deflation? Check whether prices are rising more slowly or actually dropping. If the rate is simply slowing down, your baseline costs are still creeping upward.
- Is the number headline CPI or core inflation? A tame core number does not mean much to your weekly budget if your biggest expenses are gasoline and groceries, which live in the headline figure.
- How does the rate compare to your income growth? Compare the annual percentage change in prices against your raises or benefit adjustments. If your nominal pay rises 2% while prices rise 4%, your real purchasing power is shrinking.
- What happens to fixed debts if prices fall? Be cautious about cheering for broad deflation. In a deflationary environment, wages and business revenues often shrink, while the dollar amount owed on old loans stays fixed, making monthly debt payments much heavier to carry.


