










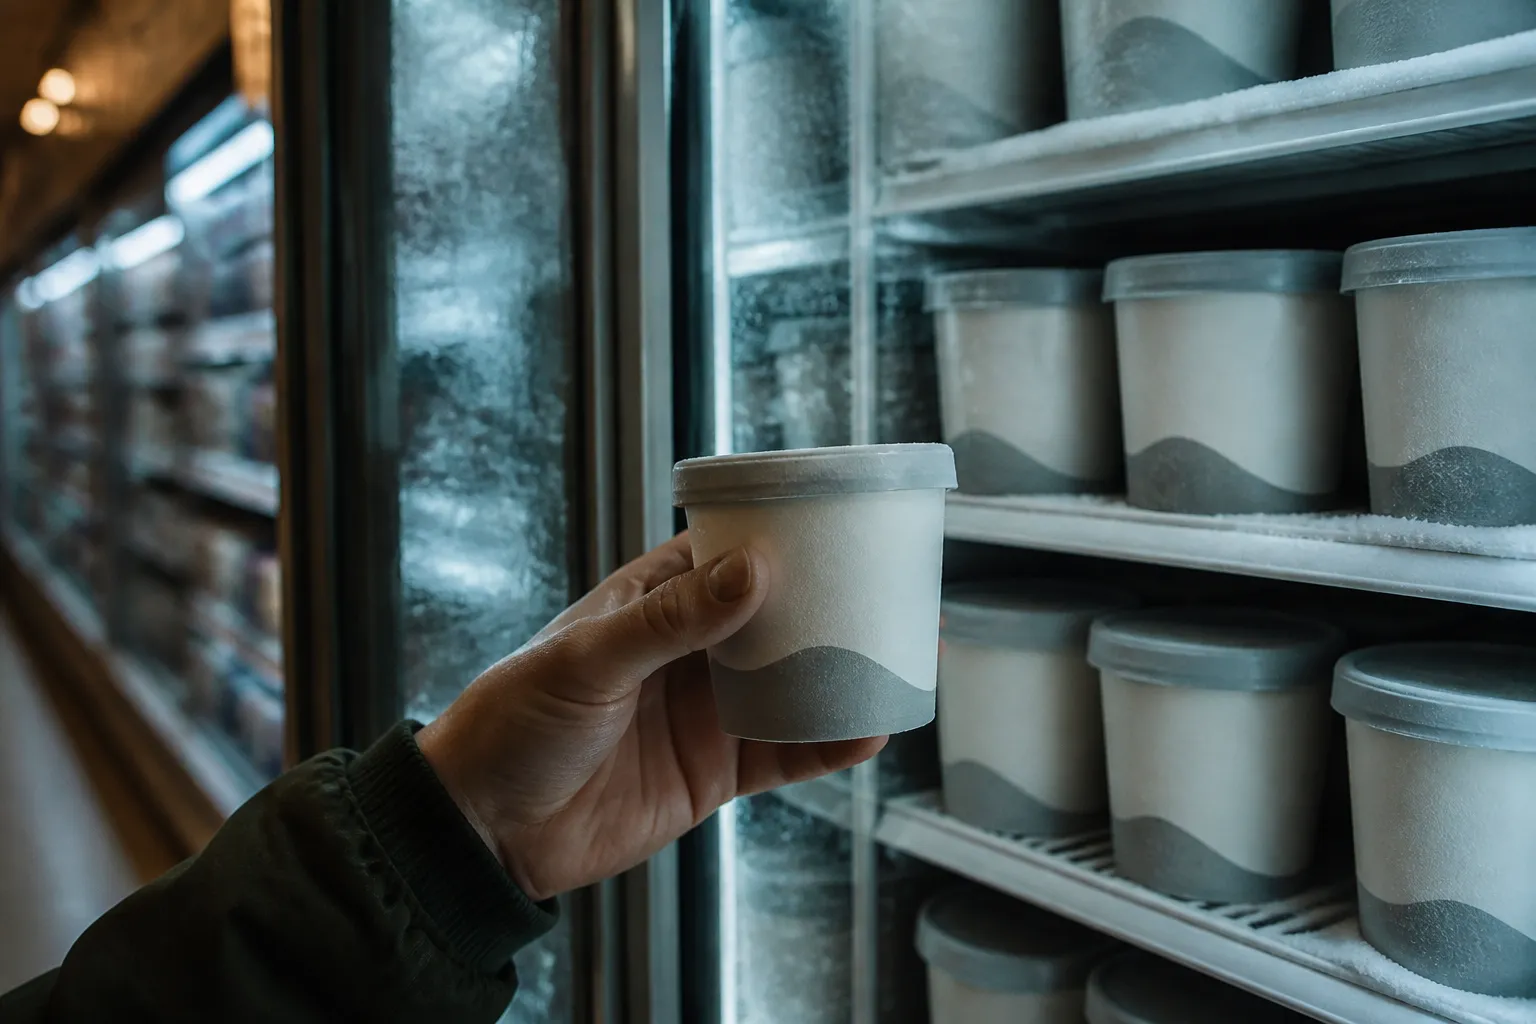
You reach into the freezer aisle for a familiar carton of ice cream. The container fits your hand the same way it did last summer, and the price tag on the shelf rail has not budged. Only the fine print near the bottom edge tells the truth: what used to be a standard 16-fluid-ounce pint now holds 14 fluid ounces. Economists and federal analysts call this product downsizing, though most shoppers know it as shrinkflation.
What shrinkflation means at the register
In plain grocery-basket math, shrinkflation happens when a manufacturer trims the amount of product inside a package without lowering the price to match. Sometimes the sticker price stays frozen. In other cases, the retail price drops by a few cents while the cost per ounce or per sheet still climbs. The U.S. Government Accountability Office (GAO) defines the practice as a reduction in product quantity without a commensurate price drop, resulting in a higher per-unit cost for the buyer.
Because household budgets usually track what we spend by the trip or by the carton, a silent cut in weight acts like a hidden price hike. If your family uses a fixed amount of laundry detergent or breakfast cereal every month, smaller packages force you to restock sooner. The register receipt looks calm on any single Tuesday, yet your purchasing power erodes one missing ounce at a time.
What federal price data actually shows
When you zoom out to the entire U.S. economy, product downsizing plays a surprisingly small role in the headline inflation numbers. A GAO analysis of federal and retail scanner data covering 2015 through 2024 found that downsizing added roughly 0.06 percentage points to the 34.5 percent rise in overall consumer prices between 2019 and 2024. Across the whole basket of goods and services that inflation indexes track, downsized items represent a modest slice.
The historical cadence of downsizing also shifts with the broader economy. Federal researchers noted that product shrinkage was most frequent in 2015, fell to its lowest levels during 2020 and 2021, and began climbing again in early 2022 as wider inflation heated up. Even inside the grocery aisles, fewer than 5 percent of items across seven tracked categories (coffee, cereal, paper towels, toilet paper, laundry detergent, toothpaste, and pain relievers) shrank between 2021 and 2023. However, those specific products carried heavy weight because they represented a disproportionately large share of retail sales.
When you zoom back in to your kitchen cabinets, the numbers hit much harder. According to GAO findings on category trends, downsizing contributed between 1.6 and 3.0 percentage points to inflation in household paper products, snacks, and breakfast cereals. Coffee saw the steepest per-unit price jump from downsizing at 32.4 percent, while paper towels had the widest reach by sales share.
Why smaller packages are so easy to miss
When production and material costs rise, manufacturers have to weigh their profit margins against how shoppers and rival brands will react. Raising the sticker price on a staple item risks driving buyers to a competitor. Trimming the net weight lets a company offset higher input costs while keeping the shelf tag familiar.
Research shows this calculation often works in the manufacturer's favor. Across 17 studies and stakeholder interviews reviewed by the GAO, consumers consistently reacted less to downsizing than to an equivalent jump in sticker price. Shoppers kept tossing the same coffee and paper towels into their carts. Brand loyalty, infrequent buying habits, and subtle container redesigns all dull our awareness at the shelf. Higher-income households also proved less sensitive to downsizing, likely because routine grocery staples take up a smaller fraction of their monthly budgets.
Physical packaging tricks make the math even harder to spot with the naked eye. As analyses of Bureau of Labor Statistics (BLS) methods point out, a bag of chips might hold extra air so it stands just as tall on the display rack, or a glass jar might feature a deeper divot molded into the bottom. The silhouette on the shelf stays identical while the net weight quietly drops.
How to spot shrinkflation using unit prices
The clearest defense against packaging illusions is the small unit-price tag pasted to the shelf lip right below the product. The National Institute of Standards and Technology (NIST) explains that uniform unit pricing translates a retail price into a standard cost per ounce, gram, liter, or sheet so shoppers can make direct value comparisons across sizes and brands. This is the exact method BLS price collectors use when they track effective price changes for the Consumer Price Index.
Take two hypothetical examples used by the BLS. First, imagine a 64-ounce half gallon of juice priced at $5.99, which works out to about 9.4 cents per ounce. If the bottle shrinks to 60 ounces while the price stays at $5.99, you are now paying just under 10 cents per ounce, a 6.7 percent price hike. Second, consider a roll of toilet paper that drops from 220 sheets to 200 sheets for the same sticker price; that sheet reduction equals a 10 percent increase in the price per sheet. You can run a quick shelf audit in two steps: first, check the package cues, and second, verify the unit math.
- Scan the high-risk aisles first. Pay the closest attention when shopping in categories with a documented history of downsizing, especially coffee, paper towels, breakfast cereal, snacks, and ice cream.
- Look past the container shape. Check the net weight or sheet count printed on the front lower corner, and watch for packaging changes like deeper bottom indentations in jars or looser, air-filled bags.
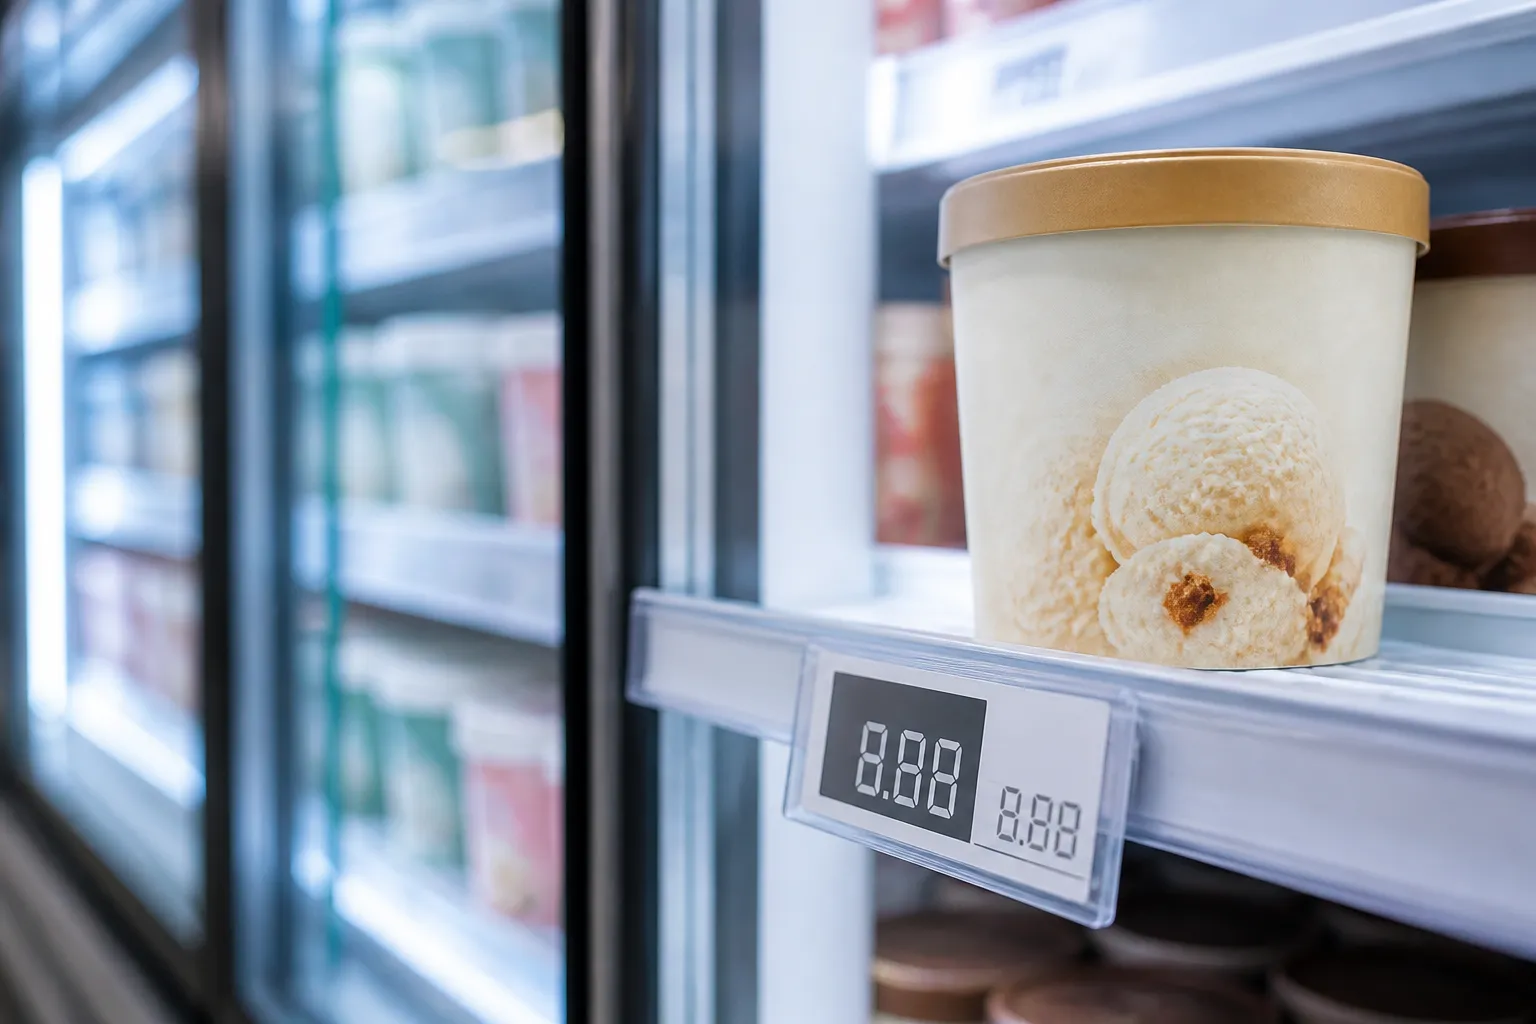
- Compare the unit price, not the retail price. Read the shelf tag's cost per ounce, pound, or 100 sheets to see how the item stacks up against competing brands and bulk sizes on the same rack.
- Test the slight price drop. If a package looks smaller and the sticker price fell by a dime, divide the price by the ounce count on your phone calculator to see if the per-unit cost still went up.
While unit-price math helps you compare what is sitting on the shelf today, it helps to keep the limits of federal data in mind. The published GAO and BLS reviews track marketplace trends from 2015 through 2024, so those historical percentages do not automatically describe what is happening on store shelves in 2026. Public reports on downsizing also leave out whether state or federal labeling laws require notices on shrunk packages, where consumers might report downsizing, or how families should restructure a household budget around smaller boxes. Treat unit pricing as a practical magnifying glass at the point of sale rather than a forecast of where grocery prices will head next.


