










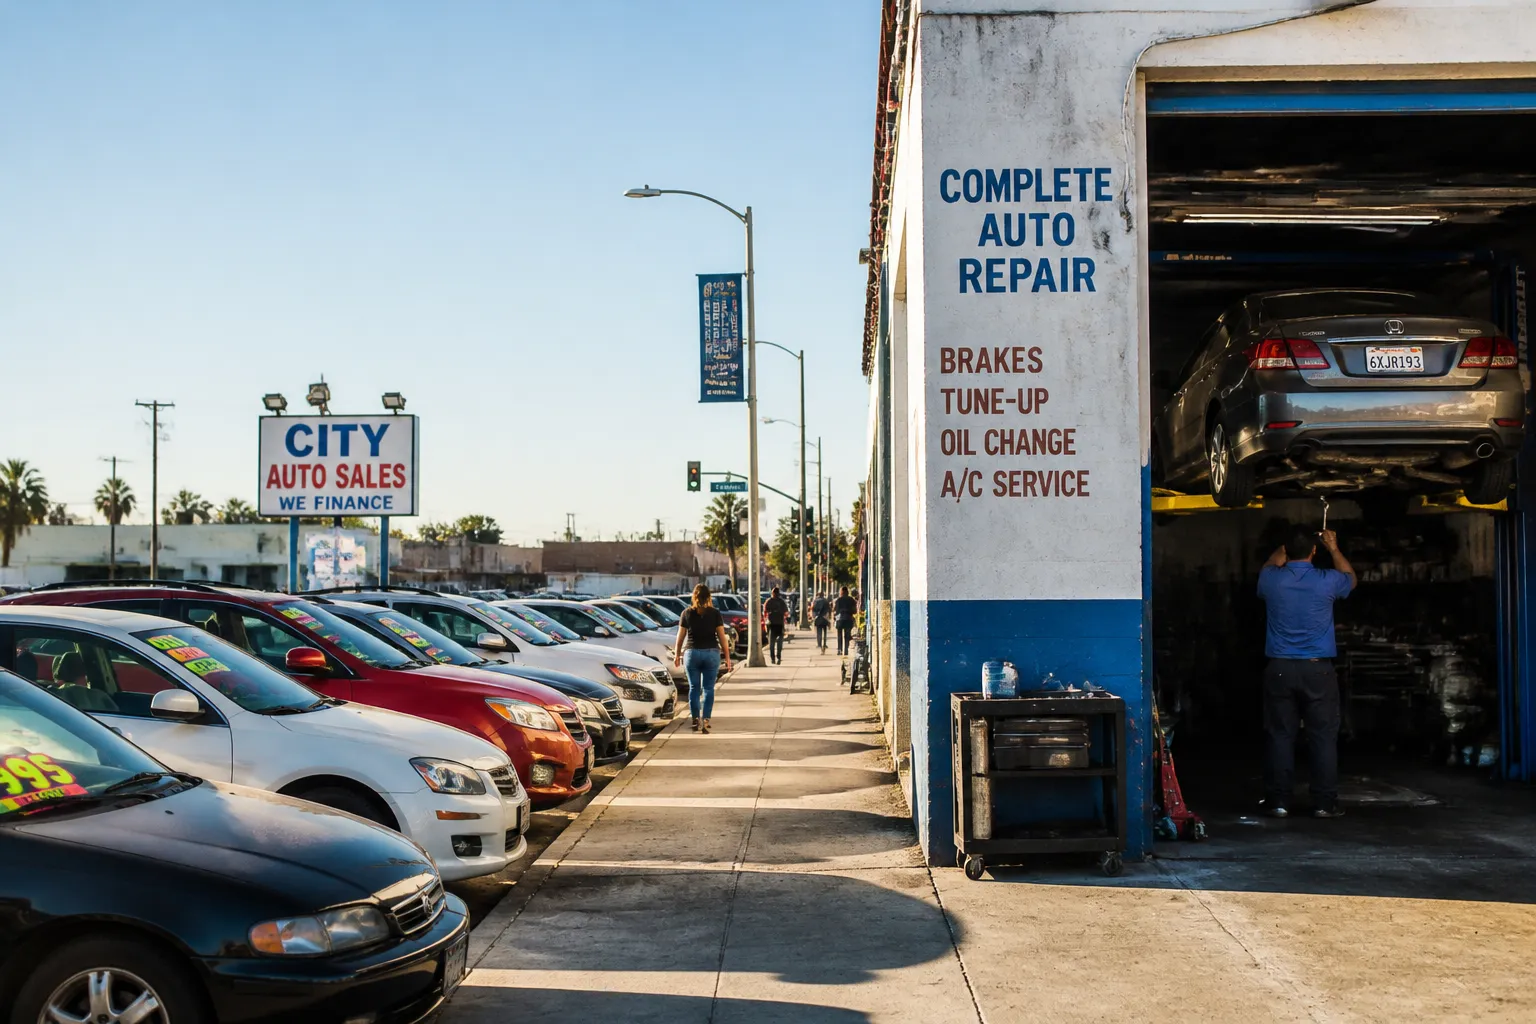
Most households split their car spending in two. One bucket is the rare, big purchase of a vehicle. The other is the steady cost of keeping it running. The federal inflation tables keep those buckets apart too. This guide covers where to look for each one, and what the published sources do and do not tell us.

Where used cars and auto repair sit in the CPI tables
The Bureau of Labor Statistics publishes the Consumer Price Index every month. The tables we checked are labeled 2026 M09, so they describe the same reporting month. Start with Table 1 of the CPI release. It covers the CPI-U, the index for all urban consumers, by expenditure category for the U.S. city average. Transportation is one of the broad groups there. It is a good first look, but it lumps many things together.
For the detail, go to Table 2, which breaks the same index into detailed expenditure categories. That is where lines for used cars and trucks, and for auto repair and maintenance, would be found. Used cars are a purchased good. Repair and maintenance is a service. Expect to scroll to find them, since they sit under different parent groups.
Before diving into rows, read the narrative. The CPI news release and the CPI summary give the month's big picture. They help you judge whether a line you care about is moving with the pack or on its own.
A caution about the numbers in this piece
This article gives no index values or percent changes. The text we could pull from the BLS pages was mostly site navigation, and the PDF version of the release was unreadable to us. Quoting a figure we could not check would be worse than leaving it out. Open Table 2 yourself and read the current row.
Here is a practical way to do that. Use your browser's find function and search for "used cars". Note the row. Then search for "repair" and note that row too. Write both down next to each other. Now you have the two numbers this guide is about.
How vehicle prices are measured
A used car line does not have to mean a simple average of lot prices. BLS publishes a factsheet on measuring price change for used cars and trucks. It also has a page on quality adjustment for new, used, and leased motor vehicles. Those two pages are the place to learn how the index handles changes in what a vehicle is, not just what it costs.
We could not verify the details of that method from the text available, so we will not summarize it. If you plan to compare a long run of years, read both pages first.
Methods also change over time. BLS posted a 2023 notice on methodology changes. The notice indicates that changes can matter when you compare series across periods. Check it before you line up old and new data.
Reading a row: monthly moves and twelve-month trends
Each row in the tables shows an index level and changes over different spans. Check the column headings on the live page, because we could not confirm how each column is labeled. Look for whether a figure is a one-month change or a twelve-month change, and whether it is seasonally adjusted.
Short moves are noisy. One month up or down says little. A twelve-month change gives a steadier read. Put the used car figure next to the repair figure for the same span. If the two differ a lot, that tells you the goods side and the services side of car ownership are not moving together.
A used car is a good that gets bought now or put off. Repair is a service that gets bought when something breaks. That difference is why the two rows can tell different stories, and it is a reason to read them as a pair.
What the tables leave out
The CPI-U is a national measure for urban consumers. It will not tell you what your mechanic charges this week. It also will not tell you what a specific make and model costs in your town. Treat it as a gauge of the overall trend.
The takeaway is simple. Open Table 2, find the used cars row and the repair row, and compare their twelve-month changes for the same month. That one comparison shows more about car costs than the transportation line in Table 1 can.


