










Anyone who runs a household budget knows the impulse to hold out for a lower price. You look at a grocery receipt or an upcoming household replacement and wonder if waiting four or eight weeks might save twenty dollars. Popular shopping advice often turns this instinct into a tidy calendar, promising that certain months always bring reliable markdowns across the store aisles. When you look at the federal price data, however, the real picture of seasonal price movement is far more restrained and demands closer reading.
What the sources can and cannot tell you about seasonal prices
Government statistical agencies track prices to measure the broader economy, not to build shopping cheatsheets. When readers dig into the public records kept by the Bureau of Labor Statistics (BLS) or the Department of Agriculture (USDA), the available material on seasonal price patterns is far more specific and technically narrow than many consumers expect. The official records focus heavily on statistical mechanics and baseline shifts rather than clear shopping calendars for every product on retail shelves.
For instance, the Bureau of Labor Statistics page on seasonal adjustment documents how the agency identifies repeating annual patterns across the consumer price index. The agency recently scheduled updated seasonal factors effective February 13, 2026, which recalculates how past regular variations are isolated. Yet those public notices do not list retail buying tricks or guarantee that a particular good will be cheaper during any specific week. They simply explain how government economists strip regular calendar noise out of long-term economic figures.
Outside of official agriculture reports, public datasets do not provide reliable seasonal calendars for big-ticket household goods like refrigerators, apparel collections, or travel bookings. General rules of thumb about holiday sales or end-of-quarter clearances are largely retail marketing conventions rather than fixed economic realities captured in consumer price series. Learning how to read the public numbers helps protect a family budget from false expectations, because no index can promise that waiting will automatically lower the final bill at the register.
Reading seasonally adjusted and unadjusted price data
To use federal price numbers effectively, shoppers must understand the difference between seasonally adjusted and unadjusted figures. The Bureau of Labor Statistics provides explicit guidance on using seasonally adjusted and unadjusted data. Unadjusted series reflect the actual dollar amounts charged at the checkout counter during a specific month. They capture real-world conditions, including weather shocks, supply shortages, and normal holiday demand spikes.
Seasonally adjusted numbers, by contrast, smooth out predictable within-year shifts. If heating oil always spikes in January or fresh fruit always dips in July, seasonal adjustment factors remove that predictable ripple so economists can see if underlying inflation is heating up or cooling off. If you are trying to understand the actual price you will encounter at the checkout line, comparing unadjusted price levels over time will give you the grounded shelf view. If you compare a seasonally adjusted month against an unadjusted month, you are comparing two completely different statistical concepts.
The statistical techniques behind these numbers are complex. As the BLS notes in its seasonal adjustment frequently asked questions and accompanying CPI seasonal adjustment tables, the agency recalculates these factors each year. A product might appear to trend downward on a seasonally adjusted chart even while the actual shelf tag remains unchanged. Checking which series you are viewing prevents you from mistaking an economist's statistical correction for an actual discount in the aisle.
Food prices: compare categories, not headlines
The grocery store is one place where detailed federal tracking meets kitchen-table budgeting. The USDA Economic Research Service provides substantive tracking through its food prices and spending data, showing how broad grocery trends conceal sharp differences across specific categories. In 2025, overall food-at-home prices rose 2.3 percent compared with 2024. That overall increase was actually lower than the 20-year historical average of 2.6 percent per year, but the topline number tells only part of the story.
Category changes diverged sharply across the grocery cart in 2025:
- Beef and veal prices jumped 11.6 percent.
- Sugar and sweets increased by 5.1 percent.
- Nonalcoholic beverages rose 3.8 percent.
- Retail egg prices stood 21.9 percent higher on average than in 2024, despite dropping steadily from April through December 2025.
That pattern in egg prices illustrates a crucial reality for household shoppers. A single month of declining prices in a specific category does not guarantee a return to past budget baselines. Monthly grocery swings in individual food groups often smooth out into modest annual shifts across the entire basket, but individual staples can remain elevated for extended periods due to specific supply pressures. Furthermore, retail prices are shaped far more by processing, transportation, packaging, and retail labor costs than by the raw farm-level commodity price. Even when harvest conditions improve at the farm gate, those operational expenses keep retail shelf prices from dropping immediately.
Using seasonal produce guidance and a simple checklist
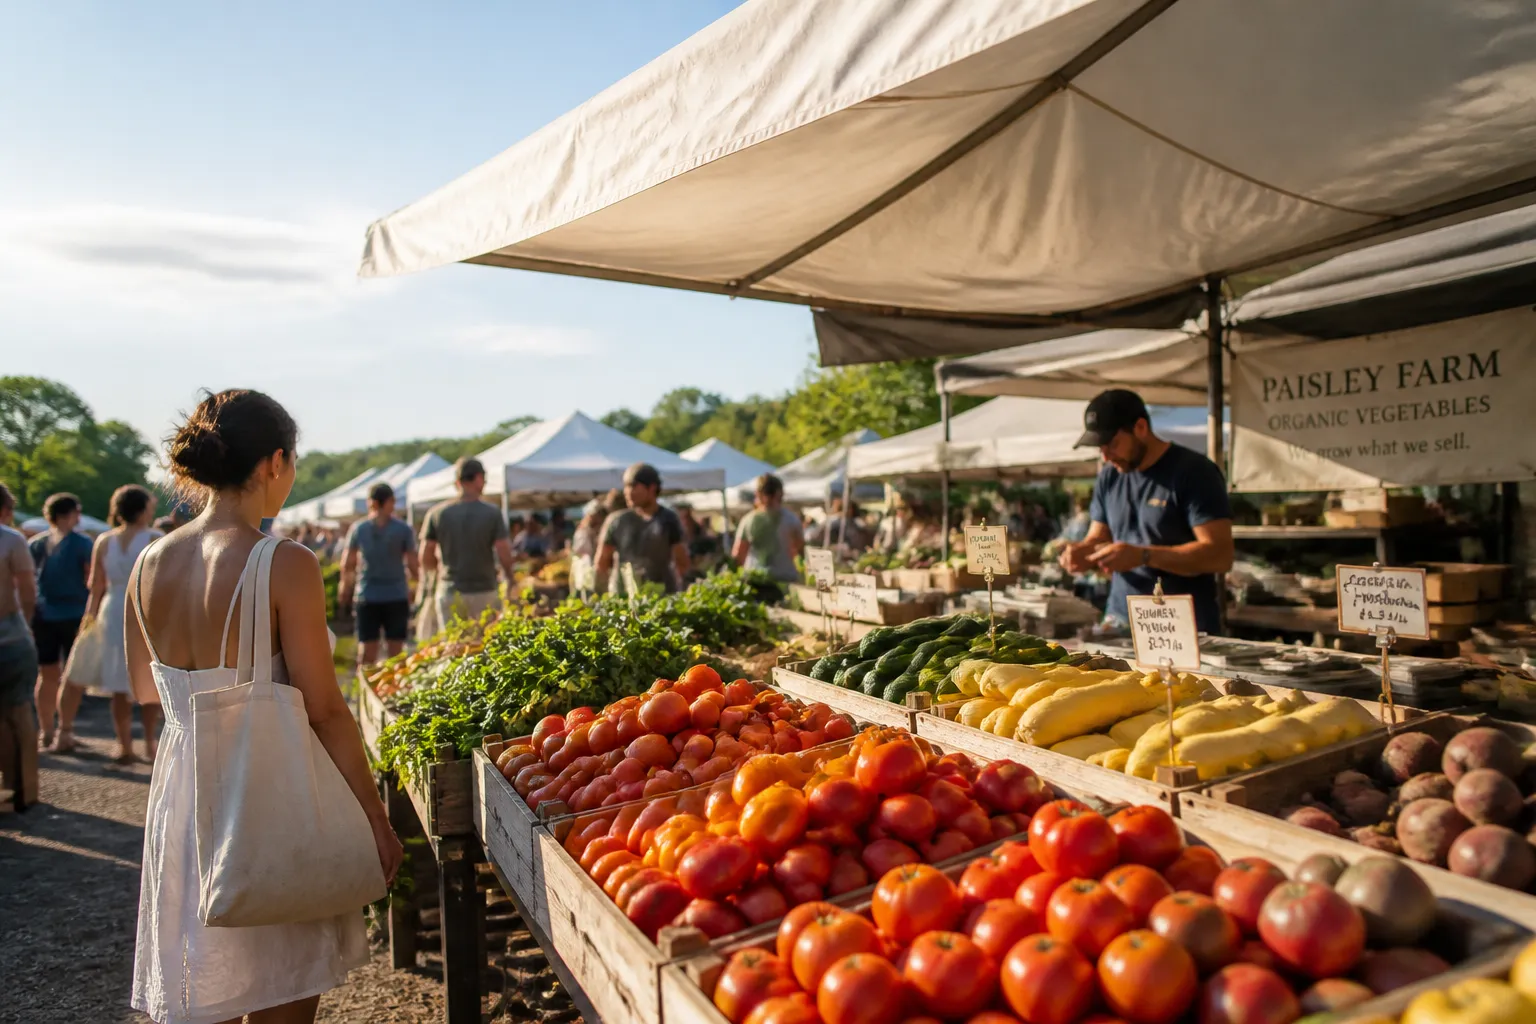
The clearest place where calendar timing truly aids consumers is the produce department. The USDA provides a Seasonal Produce Guide, supported by resources on Nutrition.gov for shopping and meal planning. These guides document when domestic crops reach peak harvest. Buying fruits and vegetables during their regional harvest windows often delivers better quality and competitive pricing, as local supplies expand and shipping distances shrink.
Before delaying a purchase in hopes of a better seasonal price, work through this simple decision checklist:
- Confirm the data series: If you are looking at economic reports, verify whether the figures are unadjusted or seasonally adjusted before making assumptions about retail price tags.
- Check the baseline factor updates: Remember that annual factor revisions, such as the February 2026 adjustments from the BLS, can alter recent historical trajectories without changing what stores charge today.
- Identify real growing seasons: Use agricultural guides to verify peak harvest periods for fresh goods rather than relying on promotional store flyers.
- Evaluate the category trend: Review whether the broader food category is facing structural inflation or short-term volatility, because a one-month dip may quickly reverse.
- Weigh the cost of waiting: Calculate whether delaying a purchase creates other household expenses, such as finance charges on an existing balance, equipment repair fees, or daily friction.
Federal price statistics do not track the precise timing of retail clearance events for non-food items like winter coats or lawn equipment. They also cannot calculate whether waiting six weeks for a minor price reduction makes sense when an older appliance is leaking or a family necessity is urgent. When making substantial financial choices or managing significant household debt, review your personal cash flow carefully and consult a qualified financial professional to determine the right balance between waiting for savings and meeting immediate needs.


