











When the price of a gallon of regular unleaded climbs by more than a dollar and a half in three months, the math at the kitchen table changes before the monthly bank statement even arrives. Energy prices work on household budgets in two distinct ways. First, they take a direct cut out of disposable income. Every extra dollar spent at the pump or on a winter utility bill is a dollar that cannot buy groceries, pay down debt, or sit in savings. Second, and just as important to economists, visible energy costs shape how families view the future of all prices across the economy.
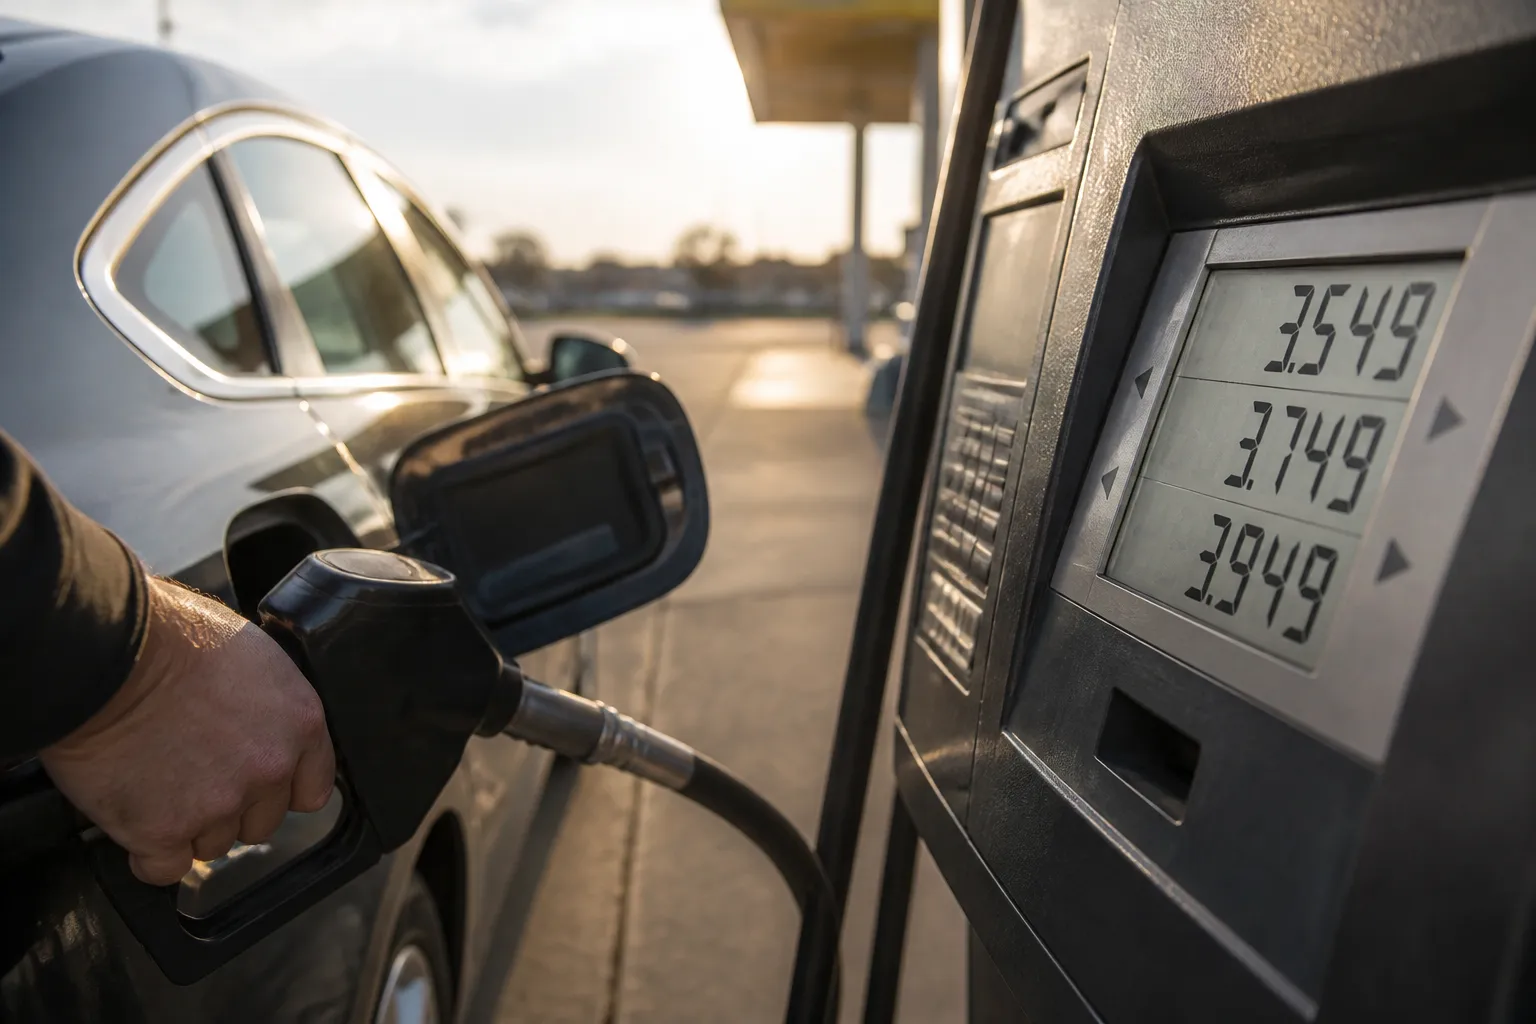
Drivers pass three-foot-tall illuminated price signs on every commute, making gasoline one of the most visible and volatile expenses in a household budget.
Why Gas Prices Shape Household Inflation Views
Most consumer prices sit quietly on store shelves until you go looking for them. You might notice the cost of eggs or ground beef once a week, and you might review your insurance premium once every six months. Gasoline is different. Because fuel prices are posted on massive roadside signs, consumers receive a daily update on energy markets whether they need to fill their tanks or not.
Research from the Federal Reserve Bank of San Francisco shows that household inflation expectations tend to move alongside expectations for gas price changes. While the link is moderate in size, it is persistent. Because gasoline is both salient and volatile, people often treat a sharp jump at the pump as a broader signal that prices are rising everywhere.
Central bankers watch these expectations closely. When families expect higher inflation down the road, that belief can influence how workers negotiate wages, how businesses set prices, and how households plan their savings. Energy prices therefore act as a psychological channel for broader inflation sentiment, rather than just a single line item in a monthly spending plan.
What Drove Recent Fuel Price Swings
To see how quickly fuel costs can alter a budget, consider a standard 15-gallon fill-up. In February 2026, before the start of the U.S.-Iran conflict, the average U.S. retail gasoline price stood at $3.06 per gallon, making a full tank cost $45.90. By May 2026, the San Francisco Fed reports that the national monthly average hit $4.65 per gallon. That same 15-gallon tank suddenly cost $69.75, an extra $23.85 per trip to the station.
Broader federal price indexes capture the scale of that shift over a full twelve-month window. According to the U.S. Bureau of Labor Statistics, gasoline prices rose 34.2 percent over the year ended September 2026. By that September mark, the U.S. Energy Information Administration (EIA) recorded average retail gasoline prices at $4.35 per gallon, while diesel averaged $6.29 per gallon.
Global geopolitical events sit behind these domestic numbers. The San Francisco Fed links the 2026 gas price swings to conflict in the Middle East and supply disruptions in the Strait of Hormuz, noting that the pattern echoes the energy spikes that followed Russia's 2022 invasion of Ukraine. The EIA attributes higher U.S. retail pump prices directly to rising crude oil costs, adding that tight diesel markets put extra upward pressure on crude demand. In its outlook, the EIA raised its fourth-quarter 2026 Brent crude forecast to an average of $105 per barrel, up $14 from its prior month's projection, while expecting crude to ease to an average of $84 per barrel the following year. Because global supply conditions shift rapidly, such forecasts serve as baseline expectations rather than settled outcomes.
Why Heating Costs Differ From Home to Home
While drivers across the country face similar pressures when crude oil rises, winter home heating bills split sharply depending on where you live and what kind of furnace sits in your basement. In its Short-Term Energy Outlook, the EIA notes that household heating expenses depend heavily on the primary fuel a home uses, assuming winter temperatures stay roughly in line with the previous winter and the 10-winter average.
- Natural gas and propane: About half of all U.S. households rely on natural gas or propane as their main heating fuel. The EIA expects these households to spend less on heat than they did the previous winter.
- Electricity: Homes that rely primarily on electric heat are projected to spend slightly more.
- Heating oil: Roughly 3 percent of U.S. households, concentrated mostly in the Northeast, heat with oil. With heating oil prices up more than 30 percent from the prior winter, the EIA expects total heating oil spending for these families to rise by 21 percent, partly buffered by a milder Northeast winter forecast.
Because the EIA baseline assumes normal seasonal weather, an unusually cold snap or an unseasonably warm stretch in any region will change what families actually pay on their monthly utility statements.
Asymmetry and Who Feels the Effect Most
One of the most striking findings in Federal Reserve research is that household psychology does not treat rising and falling gas prices equally. The San Francisco Fed documents an asymmetric relationship between the gas pump and inflation expectations. When households expect gas prices to grow faster, they revise their overall inflation expectations upward and report greater uncertainty about where future prices will land. When households expect gas price growth to slow down, their broader inflation expectations barely budge.
In plain terms, a spike at the pump rattles household confidence, while a price drop does not bring proportional relief. Once a family resets its mental math for a more expensive cost of living, cheaper fuel takes time to undo that anxiety.
This effect does not fall evenly across the population. The San Francisco Fed finds that the link between gas price expectations and broader inflation expectations is strongest among lower-income and less-educated households. For families on tighter budgets, motor fuel and home utilities represent a much larger share of monthly take-home pay. A thirty-percent swing in fuel costs does not just alter their economic outlook; it forces immediate trade-offs in the weekly grocery basket. Still, economists caution that these findings describe broad statistical patterns across groups, not a guaranteed outcome for any individual household.
What Public Data Does and Does Not Cover
Public data from federal agencies tracks price movements and consumer sentiment, including how the BLS measures household energy and how regional Federal Reserve banks study the link between fuel and expectations. Separate policy institutions also maintain broader affordability trackers and study how commercial load growth affects U.S. electricity markets.
However, macroeconomic indexes and energy outlooks have clear limits for kitchen-table planning. The federal sources examined here measure national and regional price averages, crude oil benchmarks, and survey-based inflation expectations. They do not explain how an individual household can reduce its exposure to energy price swings, nor do they cover specific household budgeting responses or state-level consumer protections for overdue utility bills. Readers looking for utility assistance rules or personal budgeting strategies will need to consult local energy offices or dedicated consumer resources, as this overview is strictly educational and does not provide personal financial advice.


