










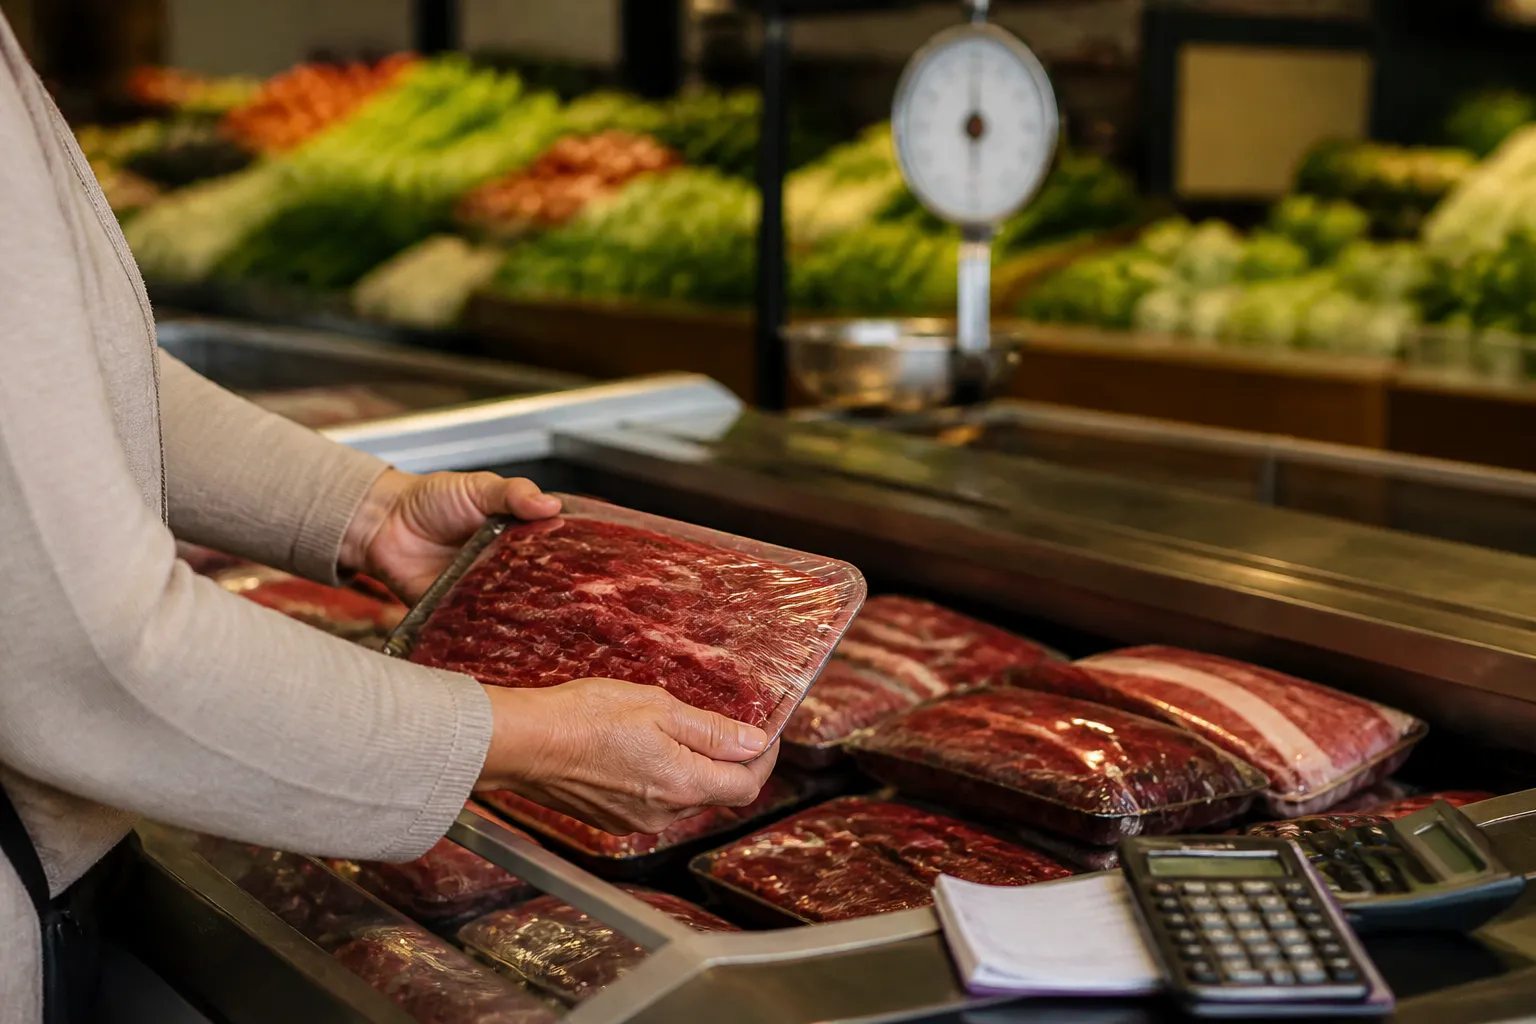
Stand at the meat counter or the produce scale and the national inflation rate can feel like a rumor from another town. Even when the federal headline number cools, specific grocery aisles can surge ahead on their own biological and weather-driven clocks. Understanding why a grocery receipt diverges from overall inflation requires looking past the summary number and into the individual bins and cases that make up the federal food index.
A calm headline inflation number can easily mask a nine-percent jump at the butcher counter or a late-season surge in the produce aisle.
How the overall index and the grocery cart part ways
The Bureau of Labor Statistics (BLS) tracks consumer inflation by pricing a wide basket of goods and services to produce the Consumer Price Index (CPI). Within that data, food is split into two distinct buckets: food at home, which covers grocery store purchases, and food away from home, which covers restaurant meals and take-out.
Those two buckets rarely move in lockstep with each other or with the broader economy. According to the USDA Economic Research Service (ERS) Food Price Outlook, the all-items CPI can run higher than overall grocery store inflation in a given window while restaurant prices climb at nearly double the grocery pace. A single month of calm grocery averages does not mean food is getting cheaper across the board, nor does it establish a permanent trend. The gap between the grocery cart and the all-items index shifts constantly because overall grocery figures are just an average of dozens of smaller aisles.
Why single aisles outrun the headline rate
The primary reason grocery bills feel volatile is that individual food categories follow biological cycles rather than general macroeconomic trends. When one major staple experiences a supply crunch, it can pull a household's actual spending way above the national average.
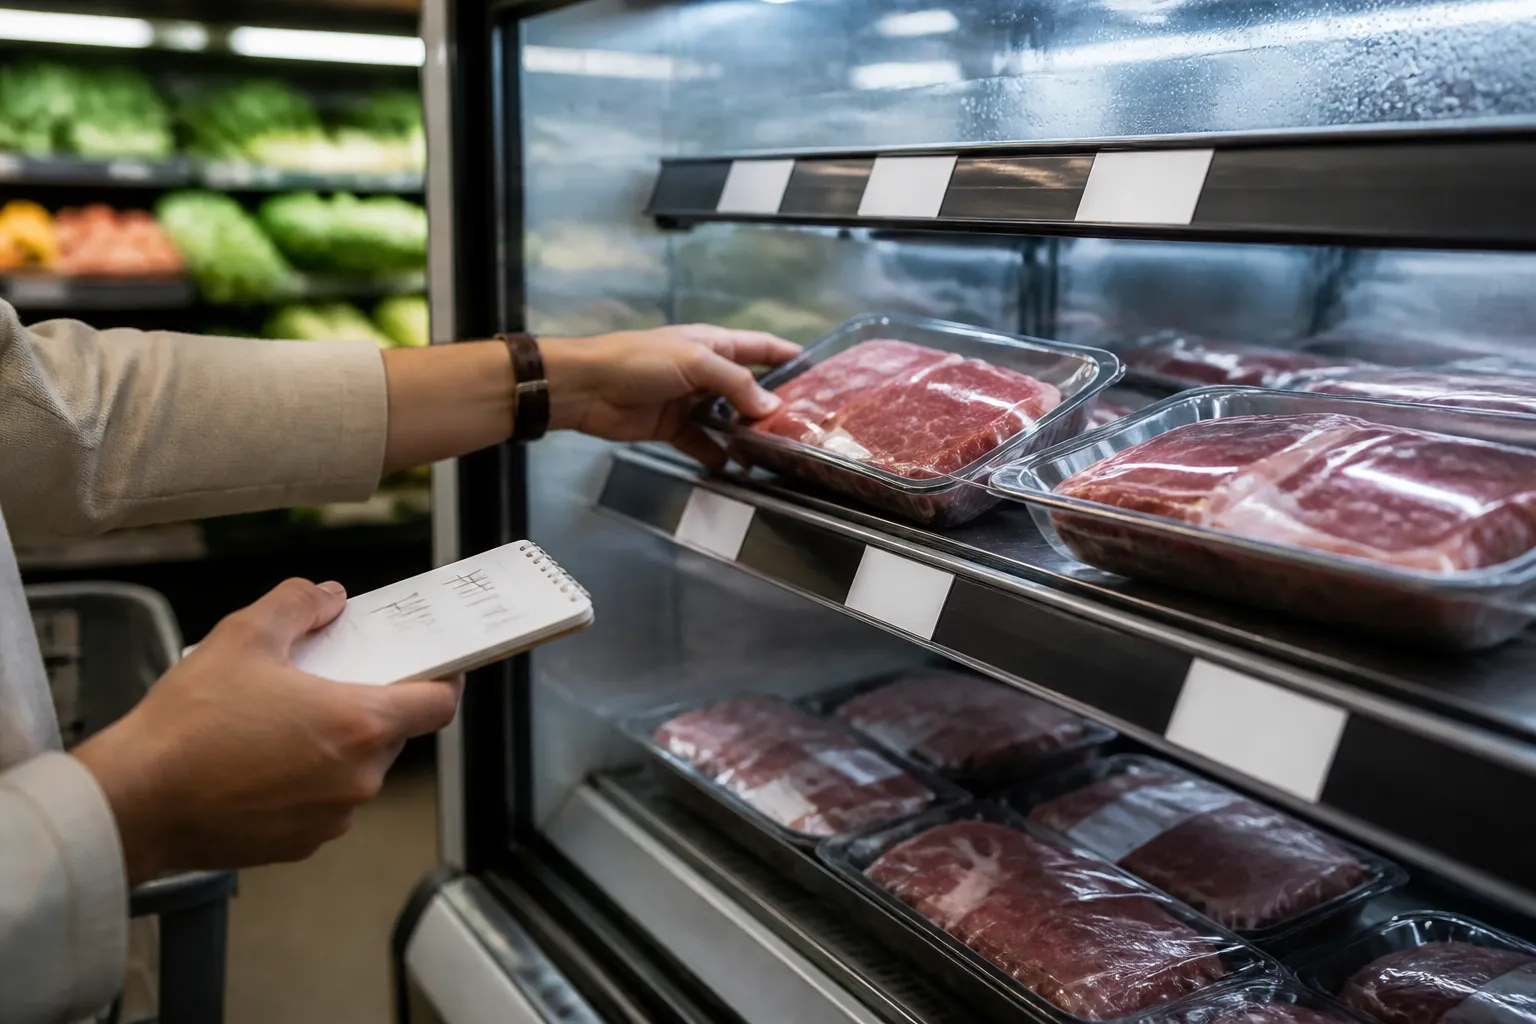
Beef is the clearest example in the 2026 projections. While the USDA projects overall food-at-home prices to rise by a modest 2.4 percent in 2026, retail beef and veal prices are forecast to jump 9.4 percent, with a projection range between 7.4 and 11.6 percent. Shoppers saw the groundwork for this earlier, when the average retail price of ground beef reached $6.92 per pound last August. Meanwhile, other protein categories are moving in completely different directions for 2026:
- Pork: Projected to rise 1.2 percent.
- Chicken and other poultry: Projected to edge up 1.0 percent.
- Eggs: Projected to fall 29.4 percent compared with 2025 levels.
A family that buys mostly eggs and chicken experiences a very different inflation rate than a family buying ground chuck and ribeye. The same split appears in the produce section. Fresh fruit prices are forecast to rise about 3 percent in 2026, outpacing the broader grocery store projection. Within that fruit measure, berries, avocados, grapes, and melons make up 59 percent of the index weight. When weather or seasonal transitions tighten the supply of those specific items, the entire fruit index climbs even if apples or bananas stay flat.
The lag between the farm gate and the checkout lane
Shoppers often wonder why a sudden change in farm conditions takes months to show up on a store receipt, or why retail prices stay high even after wholesale markets calm down. The answer lies in the difference between two federal yardsticks. As the ERS explains in its overview of food markets and prices, the CPI measures what consumers pay at the retail register, while the Producer Price Index (PPI) measures what domestic farmers and processors receive for their output.
Farm-level prices and retail shelf prices sit at opposite ends of a long supply chain. In the cattle industry, retail beef prices are being pushed upward because fewer cattle are ready for slaughter and ranchers are holding back female cattle (heifers) to rebuild depleted herds. Rising beef imports have not been large enough to close that domestic gap. Even when early signs of upstream relief appear, such as live cattle prices leveling off, ports reopening to Mexican cattle, and lower prices for imported lean trimmings, those changes take time to work through meatpackers, distributors, and grocery contracts. They do not guarantee lower shelf prices right away.
Produce follows a similar pattern. Tight fruit supplies and late-season jumps in grower prices push farm-level fruit metrics up sharply from one month to the next. Those wholesale spikes eventually filter down to the supermarket perimeter, though the exact timing varies depending on how quickly a crop spoils and how retailers price their inventory.
How to read food price reports like an economist
When headlines warn of a spike in food costs or celebrate a slowdown, a few practical checks can help you translate the news for your own kitchen table.
- Treat forecasts as ranges, not promises. The USDA revises its projections monthly as weather, disease, and trade conditions shift. A 9.4 percent beef forecast sits inside a wide 7.4 to 11.6 percent band, and early projections for 2027 suggest beef could rise another 4.7 percent while overall grocery inflation settles near 1.8 percent. Always check the original ERS or BLS releases rather than relying solely on secondary summaries.
- Separate restaurants from supermarkets. A report that cites a single number for "food inflation" is blending counter-service lunches with gallons of milk. Check whether the figure measures food at home or food away from home.
- Compare like with like on seasonal adjustments. Raw monthly price changes and seasonally adjusted index levels can point in opposite directions during the same month. For instance, the St. Louis Fed's FRED database tracks the seasonally adjusted food-at-home index (where the 1982-1984 base period equals 100), which smooths out regular harvest and holiday swings. Mixing unadjusted annual percentages with seasonally adjusted monthly ticks will distort the picture.
What the federal numbers leave out
Public price indexes are powerful tools, but they do not capture every detail of a household budget. The public summaries and BLS category charts reviewed here do not break down the exact mathematical weights the CPI assigns to each grocery aisle, nor do they cover staples like dairy, bakery goods, or canned pantry items beyond the major protein and fruit groups. They also do not detail the specific labor or lease expenses causing restaurant prices to outpace grocery stores.
Because every household builds a different cart, national averages can only offer context, not a personalized receipt. Reviewing the primary data from the BLS and the USDA can help you spot which aisles are running hot, though this article is for educational purposes and does not provide personal financial advice.


